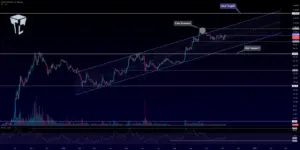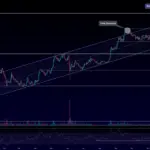
Alibaba Tokenized Stock (BABA) recently changed hands at $109.50, registering a 1.51% gain on the day as trading activity remained brisk. Throughout the session, the tokenized instrument carved out a 24-hour price range spanning from $106.42 to $109.90, keeping it anchored firmly near the upper boundary of its current trading band. This positioning places the asset just beneath immediate overhead resistance rather than deep within a volatile breakout phase, drawing close attention from traders monitoring short-term market dynamics on Binance futures, where total volume reached $6,979,135 during the tracking window.
Market analysis inherently relies on conditional scenarios rather than assured price outcomes or definitive investment advice, prompting participants to carefully evaluate the underlying data, assumptions, and timeline metrics. The recent price action underscores a period of heightened sensitivity as the tokenized instrument interacts with multiple moving averages and key technical boundaries, reflecting broader market participation and a delicate balance between persistent buying pressure and looming supply zones.
What happened and why it matters
The movement in Alibaba Tokenized Stock (BABA) to $109.50 highlights a session characterized by steady demand. By trading near the high end of its daily range between $106.42 and $109.90, the instrument demonstrates that buyers have maintained control over the immediate floor, preventing deeper pullbacks. However, this proximity to the upper boundary also brings crucial supply levels into sharp focus, defining the boundaries within which market participants must navigate their positioning.
From a structural perspective, the tokenized instrument is currently trading comfortably above several key short-term moving averages. It sits higher than its 7-day Simple Moving Average (SMA) of $104.83, its 20-day SMA of $102.70, its 50-day SMA of $107.21, its 12-day Exponential Moving Average (EMA) of $104.53, and its 26-day EMA of $104.71. This alignment indicates that the shorter-term trend structure remains relatively healthy and positioned above recent historical averages.
Despite these positive short-term readings, the broader macro backdrop remains capped by longer-term indicators. Most notably, the 200-day SMA stands significantly higher at $116.65, serving as a reminder of the broader trend parameters that continue to loom over the spot market. This dichotomy between an encouraging short-term setup and a constrained long-term moving average profile creates a complex environment for market participants attempting to forecast the next decisive directional move.
Technical structure: firmer short term, but still under supply
Examining the technical architecture of the market reveals that BABA is pressing directly against a notable resistance cluster. Immediate overhead resistance is established at $110.79, with stronger resistance waiting at $112.09. Concurrently, the upper Bollinger Band is positioned at $110.66. With the percentage B (%B) indicator registering at 0.9273, the current price is already tracking near the very top of the Bollinger envelope. This elevated reading suggests that there is relatively limited room for further price extension without a significant influx of fresh buying volume to absorb existing supply.
On the downside, support levels are considerably more defined and provide clear reference points for risk management. The daily pivot point is calculated at $108.61, offering an immediate battleground for bulls and bears. Immediate support rests at $107.31, while stronger support is found further down at $105.13. With the 14-day Average True Range (ATR) reading at $3.37, standard daily volatility is broad enough to easily test both the pivot point and the nearest support levels should market momentum falter or encounter unexpected selling pressure.
Momentum indicators present a mixed rather than cleanly directional picture. The 14-day Relative Strength Index (RSI) reads 62.75, placing the instrument in a neutral-to-firm zone that reflects steady interest without crossing into extreme overbought territory. Conversely, the stochastic %K line stands at an elevated 83.86, pointing to a potentially stretched market in the very near term. Meanwhile, the Moving Average Convergence Divergence (MACD) prints at -0.1820 with a histogram reading of 0.0000, signaling that the most recent price advance has not yet generated a strong, expanding momentum wave to fuel a larger breakout.
Derivatives positioning: buyers are active, but the signal is not one-way
Derivatives data captured from Binance futures offers additional insight into market sentiment, though the positioning leans predominantly long across several reported cohorts. The 1-hour global long/short ratio stands at 1.3714, with global accounts reflecting 57.8% long positions compared to 42.2% short positions. Top-trader accounts demonstrate an even stronger bullish preference, registering a 2.0130 ratio composed of 66.8% long positions and 33.2% short positions. Furthermore, the 1-hour taker buy/sell ratio of 2.6263 highlights a notable surge in aggressive buying activity during that specific window.
Despite this evident preference for long exposure among active traders, leverage metrics indicate a balanced approach to risk. The funding rate remains anchored at 0.0000%, showing that market participants are not currently paying an extraordinary premium to maintain either long or short leveraged positions. Open interest sits at 121,226.11 contracts, translating to an open interest value of $13,303,563, which reflects a modest 24-hour change of 0.47%. This combination of steady open interest and neutral funding rates points to stable, methodical market participation rather than a speculative frenzy or a sudden, aggressive expansion in leveraged positioning.
It is important to note that these derivatives figures specifically describe Binance futures cohorts and liquidity flows native to that particular trading venue. Consequently, they do not translate directly into underlying shareholder positioning, nor should they be interpreted as a reflection of broader equity-market conviction across traditional stock exchanges.
Analyst targets on the underlying ADRs
While the tokenized instrument operates within its own technical and derivatives framework, institutional sentiment regarding the underlying company is frequently informed by traditional equity research. The analyst notes circulating in the market apply specifically to Alibaba’s New York Stock Exchange-listed American Depositary Receipts (ADRs) rather than the tokenized version traded on digital asset platforms.
Recent updates from major financial institutions highlight sustained confidence in the underlying equities. On November 3, 2026, analyst Wei Fang at Mizuho Securities maintained a Buy rating on Alibaba while raising the ADR price target from $195 to $200. Just days prior, on November 1, 2026, Alicia Yap at Citigroup reiterated a Buy rating on the ADRs with a price target of $193.
These institutional price targets help frame the broader fundamental sentiment surrounding the underlying corporation, reflecting optimism from traditional equity analysts. However, they are not calibrated as short-term price targets for the BABA tokenized instrument on Binance futures. The digital tokenized asset continues to be governed primarily by its immediate technical setup, overhead resistance levels, and venue-specific derivatives flows.
Key levels to watch
As trading progresses, market participants are keeping a close watch on several critical price thresholds to determine the next major directional phase. If BABA successfully defends the $108.61 pivot and maintains its position above the $107.31 support level, the market retains the structural capacity to test the upper resistance zone at $110.79, followed by the stronger barrier at $112.09. A decisive move through this entire resistance band would carry significant technical weight, demonstrating that buyers possess the depth required to absorb heavy supply near the upper Bollinger Band and sustain prices well above the recent consolidation range.
Conversely, should the market experience a pullback that pushes the price below the $107.31 support level, attention will quickly shift downward toward the $105.13 mark. A breakdown beneath that threshold would weaken the prevailing short-term market structure, shifting the primary focus back toward the 50-day SMA at $107.21 and potentially opening the door for a deeper retracement toward the 20-day SMA at $102.70.
 Blockchain Technology
 Blockchain Technology
 Blockchain Technology