Difficulty: Intermediate
In 1983, legendary futures trader Richard Dennis entered into a famous wager with his longtime business partner, William Eckhardt, seeking to settle a fundamental debate in the financial world: could successful trading be systematically taught, or was it an innate talent? To test his hypothesis, Dennis recruited a diverse group of mostly inexperienced individuals, trained them intensively for approximately two weeks, and handed them real capital to trade using a strict set of mechanical rules. These participants soon became known in financial lore as the "Turtles." Decades later, one of those original recruits, Curtis Faith, detailed the complete mechanics of the system in his 2007 book, Way of the Turtle. At the heart of this legendary strategy lies a technical indicator that almost every modern charting platform still offers by default: the Donchian Channel.

To understand how these time-tested principles perform under contemporary market conditions, analysts frequently look at high-liquidity assets like Bitcoin (BTC) on daily timeframes. Historical price action illustrates the core mechanics clearly. For instance, between November 2022 and February 2023, BTC traded within a remarkably narrow range, staying constrained between 15,476 and 18,388 for roughly seven weeks, causing the Donchian Channel to flatten and tighten significantly. On January 8, price decisively broke above the 20-day high at 17,061, initiating a powerful upward trend that walked the upper band all the way to 24,255 by February 2.
What the Donchian Channel Shows
Popularized by Richard Donchian, who is widely regarded as the father of trend following, the channel consists of three distinct lines designed to track market extremes. The upper band marks the absolute highest high of the last 20 periods, the lower band registers the lowest low of the last 20 periods, and the middle line simply sits halfway between the two boundaries.
Unlike Bollinger Bands, which rely on moving averages and standard deviation calculations to measure volatility around a mean, the Donchian Channel answers one straightforward question: has price just made a new high or a new low for the specified lookback period? Because the upper band rises exclusively when a brand-new high is established, it moves in distinct horizontal steps rather than smooth curves.
The Turtle Entry: Capturing New Highs and Lows
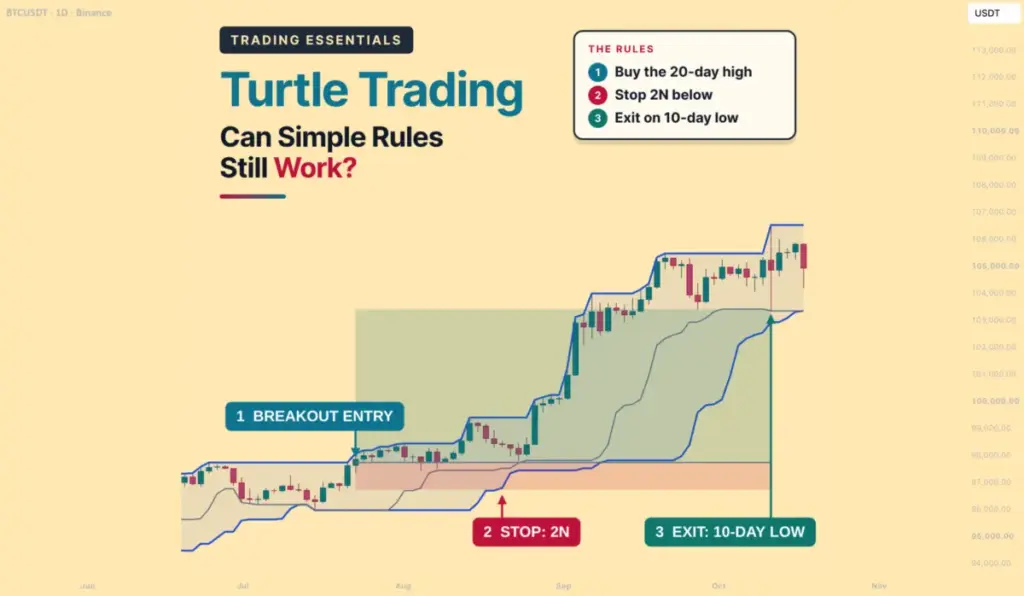
The original Turtle methodology utilized two distinct breakout systems. System 1 was a short-term approach requiring traders to buy when price broke the 20-day high or sell short when it broke the 20-day low, with positions closed when price hit a 10-day low for long trades or a 10-day high for short positions. System 2 offered a slower, more conservative alternative, entering trades on a 55-day breakout and exiting upon a 20-day breakout in the opposite direction. Furthermore, System 1 incorporated an important filter: a new signal would be skipped entirely if the immediately preceding breakout had resulted in a winning trade.
The underlying logic governing both systems is remarkably simple yet profound. A major trend cannot possibly begin without price first achieving new highs or new lows. By committing capital to every new 20-day or 55-day high, a trader positions themselves to capture massive, extended uptrends. The inherent cost of this approach, however, is enduring numerous small false breakouts along the way.
Executing a System 1 Trade: Entry, Stops, and Exits
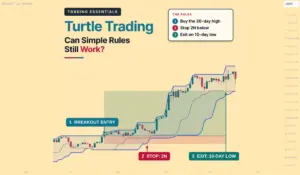
Examining historical data, such as BTC on the daily timeframe between June and August 2025, demonstrates how these rules operate in practice. On July 2, price broke the 20-day high at 108,952. With volatility—measured by an indicator the Turtles called "N"—sitting at approximately 2,698, the protective stop-loss was placed precisely 2N below the entry price, near 103,556. Bitcoin subsequently surged to 123,218 by July 14 before experiencing a corrective pullback. On July 25, price breached the 10-day low at 115,737, and the trade was officially closed for a realized gain of about 1.3 times the initial risk.
This specific sequence highlights a defining characteristic of the Turtle method: the exit rule intentionally gave back a substantial portion of the unrealized profits accumulated near the July 14 high. For trend followers, this behavior is entirely normal. Because the exit mechanism waits for definitive proof that a trend has genuinely halted, it almost always surrenders some peak profits. In exchange, however, it rarely cuts a major, multi-week trend short prematurely.
Traders frequently find that Turtle exits feel frustratingly late by design. For those tempted to lock in profits early, the system serves as a reminder that overall profitability relies heavily on the rare, outlier trades that continue running indefinitely.
Embracing Failed Breakouts as Part of the Plan
A closer look at market behavior reveals a sobering reality: the vast majority of breakouts ultimately fail. Analyzing BTC daily charts from August through October 2025 illustrates this dynamic vividly. Over the course of those two months, System 1 generated five separate signals in alternating directions: a long entry on August 11, a short on August 22, a long on September 15, a short on September 25, and another long on October 1. Each of these trades ultimately terminated in a stop-loss or a minor loss as price oscillated violently back and forth inside a broad consolidation range.
As Curtis Faith explains in his writings, trend-following systems of this nature frequently lose on a higher percentage of trades than they win. Despite this low win rate, they remain highly profitable over the long term because their winning trades are exponentially larger than their losing ones. Small losses are strictly contained by the 2N stop-loss and the systematic exit rules, while large wins are allowed to compound as successful trends run unimpeded for weeks or months. The psychological hurdle, however, remains immense: following the mechanical rules faithfully after enduring a protracted series of consecutive losses requires exceptional discipline, especially when any subsequent signal could be the massive trend that pays for all previous drawdowns. This exact psychological barrier is where many market participants abandon the methodology, often moments before a significant trend materializes.
N: Letting Volatility Dictate Risk
To manage exposure effectively, the Turtles relied on a metric they designated as "N." Representing the 20-day exponential moving average of the true range—conceptually identical to the modern Average True Range (ATR)—N served two critical functions within the architecture of the system. First, it determined the placement of the stop-loss, which was set exactly 2N away from the entry price. In a quiet, low-volatility market, this stop sat relatively close to the entry, whereas in a turbulent, highly volatile environment, the stop automatically widened to accommodate normal market noise. Second, N governed position sizing. Each position, referred to as a "unit," was carefully sized so that a adverse price movement equal to 1N would result in a capital change of approximately one percent of the total account equity.
For instance, assuming an account balance of 100,000 and an N value of 2,150, a single unit would equate to roughly 0.47 BTC. If the protective 2N stop-loss were subsequently triggered, the total realized loss would be held safely near two percent of the total account balance. When market volatility increases, this mathematical rule automatically reduces the physical size of the position, ensuring that overall portfolio risk remains strictly constant regardless of external market conditions. Even for traders who choose not to trade breakouts, utilizing volatility to size positions remains one of the most effective ways to prevent wild market swings from inflicting catastrophic losses.
System 2 and Complete Multi-Unit Trade Plans
For traders seeking fewer false signals, System 2 utilizes the slower 55-day channel. Observed on BTC daily charts between December 2025 and March 2026, a notable setup occurred when price broke the 55-day low at 84,450 on January 29. With N hovering near 2,469, the protective short stop was placed 2N above the entry, near 89,388. As Bitcoin plunged toward 60,000 by February 6, the trade accumulated significant downward momentum before a break of the 20-day high at 70,983 on March 4 closed the short position for a gain of roughly 2.7 times the initial risk.
The 55-day channel naturally produces fewer trading signals than its 20-day counterpart, effectively filtering out minor market noise to capture only substantial directional shifts, albeit with later entries and exits. Furthermore, the Turtles frequently employed scaling-in techniques during strong trends. Reviewing price action from September through December 2024 reveals a classic scaling sequence: following an initial breakout above the 20-day high at 66,500 on October 15, additional units were added incrementally every half-N in favor of the trade, up to a maximum limit of four units. Each time a new unit was added, the stop-loss for the entire aggregate position was adjusted upward to remain 2N below the most recent entry. When price finally breached the 10-day low on December 5 at 90,791, all four units were liquidated simultaneously, capturing one of the year’s most lucrative multi-unit trend movements.
Ultimately, Turtle Trading does not attempt to forecast future price trajectories. Instead, it accepts a high frequency of small, controlled losses in exchange for maintaining exposure to rare, outsized trends, utilizing objective volatility metrics to keep every individual risk strictly contained.
 Crypto Investing & Trading
 Crypto Investing & Trading
 Crypto Investing & Trading