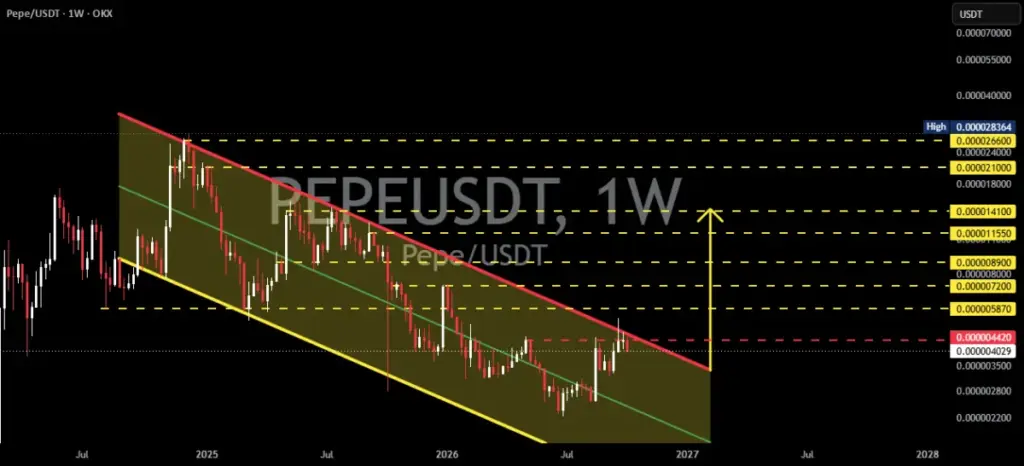
The popular meme-inspired cryptocurrency PEPE is currently navigating a pivotal technical juncture on its higher-timeframe charts. Trading within a well-defined Descending Channel structure on the 1-week (1W) timeframe, the digital asset is pressing against its upper boundary, drawing intense scrutiny from traders and market analysts alike. This macro-level channel, characterized by two parallel, downward-sloping trendlines, has historically dictated the token’s price trajectory, with the upper boundary repeatedly acting as a formidable dynamic resistance barrier that suppresses bullish advances. Conversely, the lower trendline has consistently served as a dynamic support level, sparking intermittent price rebounds during periods of broader market consolidation or contraction.
Recent price action, however, shows PEPE staging a notable recovery from the lower operational bounds of this multi-week channel. By clawing its way back upward, the asset has arrived at the doorstep of the upper trendline, establishing a critical battleground for market dominance. Analysts emphasize that this localized convergence is of paramount importance because a confirmed and validated breakout could fundamentally alter the medium-term market structure, tilting sentiment decisively toward a bullish outlook. Nevertheless, market participants remain cautious, noting that until PEPE definitively confirms a breakout via a decisive weekly candle close above this overhead resistance, the overarching descending channel structure remains entirely valid and in play.
Understanding the Bullish Scenario and Long-Term Targets
The argument for a bullish reversal gains substantial traction if PEPE can successfully pierce the upper trendline of the descending channel and, crucially, sustain its valuation above that threshold. In technical analysis, a successful breakout on a high-timeframe chart like the weekly interval carries considerably more weight than intraday shifts on lower timeframes, signaling a potential paradigm shift in momentum rather than a fleeting liquidity sweep.
Should this bullish scenario materialize and secure confirmation, market watchers are eyeing a sequential ladder of resistance levels mapped out on the charts as potential upside targets. The initial milestones on this projected upward path include 0.00005870 and 0.00007200, followed by more robust hurdles at 0.00008900 and the major resistance markers sitting at 0.00011550 and 0.00014100. If buying momentum proves resilient enough to absorb selling pressure across these mid-tier zones, the asset could challenge stronger structural ceilings located at 0.00021000 and 0.00026600. An aggressive continuation past these milestones could ultimately propel PEPE toward the broader 0.00026600 to 0.00028364 supply zone.
For conservative traders, however, the validation of this bullish thesis requires a strict criteria checklist. A simple wick above the trendline is insufficient; the market demands a definitive weekly close above the upper boundary, a successful clearance of immediate resistance, and a subsequent retest of the broken trendline acting as newfound structural support. Without this rigorous confirmation sequence, the risk of a false breakout remains elevated.
The Bearish Alternative and Downside Risks
Conversely, the optimistic outlook faces immediate invalidation if PEPE suffers a strong, definitive rejection from the upper trendline of the descending channel. Such a rejection would demonstrate that sellers maintain overall control of the macro trend, leaving the established downward channel entirely intact.
In the event of a failed breakout attempt, market participants anticipate a resumption of the prevailing downtrend. Should nearby support zones fail to absorb the incoming supply, PEPE could experience a downward slide toward the 0.00003500 to 0.00002800 liquidity cluster. A failure to hold these intermediary zones—particularly if accompanied by a breakdown of the channel’s lower boundary—would likely accelerate the bearish market structure, exposing the cryptocurrency to deeper historical support levels and intensifying selling pressure.
Market technicians point out that the ultimate invalidation of the bullish thesis involves a failed breakout attempt immediately followed by a sharp rejection back inside the channel, accompanied by surging trading volumes favoring the bearish side. This dynamic would reaffirm the validity of the descending channel and underscore the persistent influence of macro-level sellers.
Anatomy of the Descending Channel
To fully contextualize PEPE’s current positioning, market analysts frequently revisit the structural mechanics of the descending channel pattern. Formed when an asset’s price action oscillates between two parallel trendlines that slope downward from left to right, this pattern inherently reflects a dominant seller-controlled environment. In the case of PEPE, the upper line functions as dynamic resistance, capping rallies, while the lower line acts as dynamic support, cushioning sell-offs.
While such a structure fundamentally signals a bearish bias as long as prices remain confined beneath the upper boundary, a breakout to the upside often serves as an early warning sign of an impending trend exhaustion among sellers. Because this specific analysis is anchored to the 1-week timeframe, the implications of a structural breach are amplified. Weekly charts filter out the market noise typical of daily or hourly intervals, meaning that any confirmed directional shift on this scale tends to dictate market direction over a much longer horizon.
Key Price Levels to Monitor
Market participants tracking PEPE are keeping a close watch on a specific ledger of technical thresholds that will likely dictate the token’s immediate path. Near-term resistance sits around the 0.00004420 mark, serving as the immediate breakout area that price must conquer to challenge the upper trendline effectively. Beyond that, the aforementioned ladder of resistance includes 0.00005870, 0.00007200, 0.00008900, 0.00011550, 0.00014100, 0.00021000, and 0.00026600, culminating in the higher chart area near 0.00028364.
Ultimately, PEPE finds itself at a fascinating and delicate technical juncture. While the approach toward the upper boundary of the long-term weekly descending channel offers a glimmer of hope for a structural recovery, market conditions dictate patience. Until a verified weekly candle close and subsequent support retest materialize, analysts urge caution, advising participants to wait for concrete confirmation rather than preemptively reacting to unconfirmed volatility.
 Crypto Investing & Trading
 Crypto Investing & Trading
 Crypto Investing & Trading