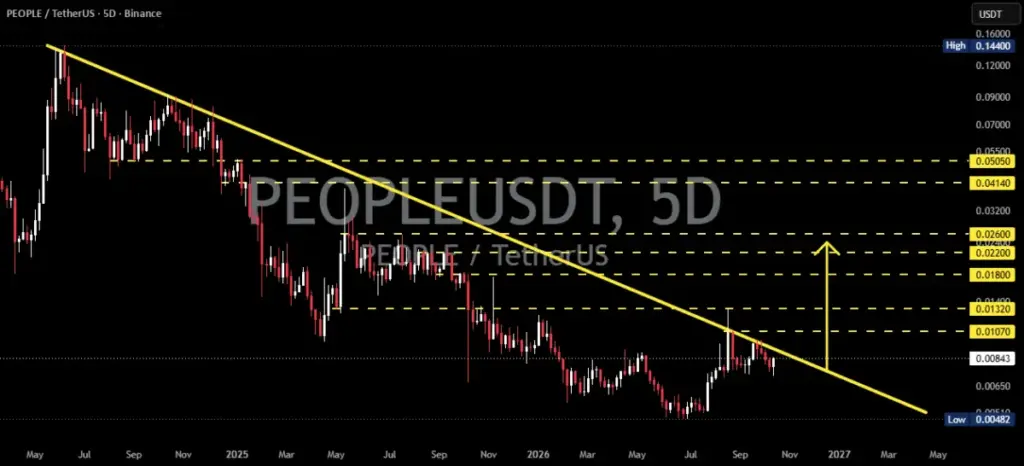
The digital asset market continues to closely monitor the price action surrounding the PEOPLEUSDT trading pair, which finds itself at a critical technical juncture. Trading significantly below a long-term descending trendline, the token reflects an ongoing narrative where persistent selling pressure dominates its overall price structure. Ever since reaching a notable peak of approximately $0.14400, the market has carved out a distinct path characterized by a continuous sequence of lower highs and lower lows, painting the picture of a prolonged and entrenched bearish phase.
Yet, as the asset trades around the $0.00830 mark, market participants are observing a critical inflection point. This proximity to a structural boundary raises pressing questions across the trading community. Observers are weighing whether the token possesses the necessary momentum to finally break out above the descending trendline to confirm a potential trend reversal, or if it will inevitably encounter another rejection, trapping the asset deeper within its prevailing downward trajectory.
To understand the weight of the current situation, analysts look closely at the mechanics of the descending trendline currently governing the chart. This downward-sloping boundary acts as a visual representation of persistent seller dominance. Every historical attempt by buyers to stage a recovery has been met with aggressive selling pressure near this barrier, resulting in the continuous formation of lower peaks. As long as the price remains constrained beneath this line, the overarching market structure remains undeniably bearish.
Furthermore, the descending trendline functions as a formidable dynamic resistance level. For any meaningful bullish recovery to take shape, this barrier must be decisively dismantled. While a breakout backed by robust momentum and surging trading volume could spark a significant trend reversal, market participants remain cautious. A breakout is not a foregone conclusion, and until the price breaches the trendline and successfully sustains its position above it, any bullish scenario remains purely speculative, requiring rigorous confirmation through price action and volume metrics.
Evaluating the broader landscape reveals a complex matrix of horizontal support and resistance zones mapped across the historical chart data. At the upper end of the spectrum, major resistance looms heavily around the $0.05050 mark, flanked by a secondary resistance zone situated near $0.04140. Further down, potential bullish targets and intermediate hurdles emerge at various intervals, including $0.02600, $0.02200, and $0.01800. Closer to the current trading price of $0.00830, initial resistance levels await just above at $0.01070 and $0.01320 following any potential breakout. Conversely, on the downside, the historical low recorded on the chart rests at approximately $0.00482, serving as a stark reminder of the asset’s historical lows. These charted values represent essential geographical markers for traders rather than absolute guarantees of precise price reactions.
A shift toward a bullish scenario hinges entirely on a confirmed breakout above the descending trendline. Should the token manage to pierce this resistance and establish a firm foothold above it, the doors could open for a gradual development of positive market momentum. Analysts outline a multi-stage progression for such a recovery to materialize. The process would logically begin with an initial breakout characterized by a convincing candle close above the trendline. Following this, a crucial retest phase would need to unfold, wherein the price dips back to test the newly converted support level and successfully holds its ground.
Once this structural integrity is proven, the market would then set its sights on clearing the initial resistance at $0.01070. Successfully navigating this hurdle could pave the way toward the $0.01320 target, before challenging the more robust resistance zone spanning between $0.01800 and $0.02200. Should buying pressure prove exceptionally resilient over an extended period, an ambitious push toward the $0.02600 level comes into view, with the broader $0.04140 to $0.05050 region serving as a long-term horizon. Nevertheless, market veterans emphasize that these milestones represent conditional possibilities rather than guaranteed forecasts, requiring each successive resistance level to be overcome with conviction.
Conversely, the bearish scenario remains a potent and active threat. If the digital asset encounters yet another rejection at the descending trendline, the long-term bearish structure will likely reassert itself with renewed force. Warning signs of this outcome would manifest as a failure to penetrate the trendline, leading immediately to the formation of yet another lower high. As the price weakens following its encounter with dynamic resistance, any subsequent loss of local support would amplify downside risks. Under such conditions, attention would quickly pivot back toward the historical low of $0.00482. A decisive break beneath this floor could severely compromise any near-term hopes for recovery, extending the bearish pain into uncharted territory.
Navigating this environment requires strict adherence to confirmation signals rather than acting on premature assumptions. Before market participants can safely conclude that a genuine bullish trend reversal has begun, several technical criteria must be met. Essential requirements include a decisive five-day candle close above the descending trendline, accompanied by a noticeable expansion in trading volume that validates the move. Additionally, the price must successfully navigate a retest of the breakout zone without forfeiting its gains, while the broader chart structure transitions from forming lower lows to printing higher highs and higher lows.
Clearing the immediate overhead hurdles at $0.01070 and $0.01320 in a progressive manner will also serve as a vital litmus test for the sustainability of the move. Without these supporting elements, any initial surge risks falling victim to a false breakout, characterized by low volume and a swift retracement back beneath the trendline.
Ultimately, PEOPLEUSDT remains locked in a persistent long-term bearish structure, yet the descending trendline stands as the definitive battleground for a potential shift in market momentum. While a confirmed breakout, a successful retest, and the systematic dismantling of overhead resistance could lay the groundwork for a broader recovery, a failure at the trendline threatens to plunge the asset back toward its historical lows. As the market digests these competing forces, the ultimate trajectory of the token will be dictated entirely by volume, price action, and the structural integrity of the breakout attempt.
 Crypto Investing & Trading
 Crypto Investing & Trading
 Crypto Investing & Trading