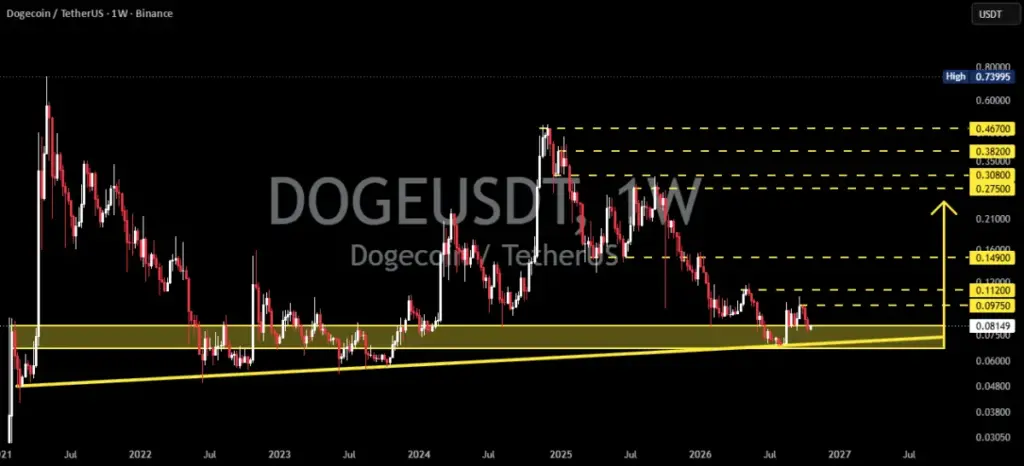
Dogecoin, the world’s leading meme cryptocurrency by market capitalization, has once again found itself at a critical technical juncture. Following an extended and punishing downward trend from its previous market highs, DOGE has retraced back to a pivotal long-term support zone situated between $0.067 and $0.0815. This specific price region has historically functioned as a robust accumulation area, acting as a formidable price base where buyers have routinely stepped in to absorb selling pressure during past market corrections.
The primary question facing market participants, traders, and investors alike is whether current buyers possess the conviction and capital necessary to defend this foundational zone and spark a meaningful recovery rally, or if persistent bearish momentum will ultimately force a breakdown toward significantly lower valuation levels. The intersection of historical horizontal demand and macro-level structural support lines makes the current price action one of the most closely watched developments in the broader digital asset market.
Pattern Analysis: The Confluence of Long-Term Ascending Support and Horizontal Demand
To understand the weight of the current situation, market analysts point to the powerful convergence of technical indicators currently surrounding Dogecoin. The first major pillar of this support network is a long-term ascending trendline, visually mapped in yellow across historical charts, which successfully connects major structural lows established over previous market cycles. This rising trendline represents the underlying macroeconomic framework for DOGE’s long-term bullish structure.
As the token drifts lower, it is simultaneously colliding with this rising structural floor while testing the established horizontal demand zone spanning from $0.067 to $0.0815. This dual-layer technical setup creates a high-stakes environment. In technical analysis, the confluence of a multi-year ascending trendline and a historical horizontal liquidity pool frequently increases the probability of a decisive market reaction. This makes the current price band the absolute epicenter for determining Dogecoin’s next major cyclical trajectory.
This highlighted historical zone has a proven track record of attracting significant buyer interest. Throughout previous market cycles, accumulation within the $0.067 to $0.0815 range has preceded substantial relief rallies and structural recoveries. However, market veterans frequently caution that historical precedent does not guarantee future performance. While the possibility of a bullish rebound remains wide open as long as DOGE respects the lower boundaries of this support shelf, confirmation through immediate price action remains an absolute prerequisite before positioning for a sustained reversal.
Underpinning these immediate support tests is a broader context: Dogecoin has grappled with a prolonged long-term downtrend characterized by a consistent series of lower highs following its notable peak in 2025. This persistent formation demonstrates that selling pressure has maintained structural dominance across higher timeframes. For the overarching market sentiment to shift from defensive caution to renewed optimism, a sustained recovery breaking above the nearest overhead resistance levels will be strictly necessary. Such a move would signal to the market that bearish momentum is finally fading and that the foundations for a broader trend reversal are actively taking shape.
The Bullish Scenario: Defending Support and Launching a Multi-Stage Recovery
Should the collective force of the market successfully defend the $0.067 to $0.0815 support zone, the stage could be set for a robust bullish counter-offensive. In this optimistic scenario, buyers would likely target a series of increasingly difficult resistance ceilings as momentum builds.
The initial upside hurdle rests between $0.0975 and $0.1120. Overcoming these immediate barriers would validate the strength of the initial bounce. Beyond those near-term targets, the path of recovery encounters a major resistance level at $0.1490, a threshold that historically separates minor relief bounces from more substantial trend shifts.
For traders looking further out, additional higher-timeframe targets loom above, though reaching them would require sweeping market-wide momentum. These include the $0.2750 mark, the major historical resistance zone around $0.3080, and more ambitious long-term targets sitting at $0.3820 and $0.4670, respectively.
However, market analysts emphasize that achieving these higher goals depends entirely on structural confirmation. A successful defense of the baseline support zone, followed by an aggressive rebound and a definitive weekly candle close above the $0.0975 to $0.1120 resistance band, would provide the first tangible proof of a shifting market structure. A subsequent breakout past $0.1490 would offer even stronger confirmation that buyers have regained control. These loftier targets represent conditional long-term milestones rather than guaranteed outcomes, as DOGE would need to systematically overcome multiple layers of overhead selling pressure to realize them.
The Bearish Scenario: Breakdown of Support and Downside Exposure
Conversely, the market must also account for the mounting risks associated with a failure to hold this crucial price floor. If selling pressure overwhelms demand and DOGE fails to defend the $0.067 to $0.0815 zone, the long-term bullish support structure could sustain severe, potentially irreversible damage.
The primary indicator of a bearish confirmation would be a decisive weekly close below the $0.067 threshold. Such a close would officially signal a structural breakdown of the historical demand zone, invalidating the multi-year accumulation thesis. Furthermore, a failed retest of this former support area from underneath—where the old floor transforms into a new ceiling of resistance—would solidify the bearish shift.
Under these conditions, continued selling pressure would expose Dogecoin to uncharted or previously bypassed lower price levels, with subsequent downside targets requiring fresh technical charting to accurately map. Market technicians note, however, that temporary wicks below support do not automatically spell disaster. Only confirmed weekly closing prices and subsequent candle formations can definitively validate a macro breakdown, shielding the asset from panicked reactions to short-term intraday volatility.
Key Levels to Watch as the Market Decides its Path
As Dogecoin navigates this critical crossroads, traders and analysts are keeping a watchful eye on a well-defined roadmap of horizontal and structural price levels. The absolute baseline for the bulls remains the major support zone anchored between $0.067 and $0.0815.
On the flip side, the immediate battlegrounds begin at the near-term resistance band of $0.0975 to $0.1120. Just beyond that lies the major technical resistance at $0.1490, which serves as the gatekeeper for any intermediate trend continuation. For those eyeing long-term horizons, heavier overhead resistance zones are stacked between $0.2750 and $0.3080, with major long-term ceilings stretching all the way from $0.3820 to $0.4670.
Ultimately, Dogecoin is facing a definitive decision point on the weekly timeframe. The ongoing interaction with the $0.067 to $0.0815 support area will dictate whether the digital asset can orchestrate a durable recovery or succumb to a deeper macro downtrend. While holding the support and reclaiming nearby resistance lines opens the door to broader bullish participation, a confirmed weekly close below $0.067 strips away the immediate safety net and exposes the token to renewed downside risk. Patience, careful risk management, and confirmation from upcoming weekly closes will remain the ultimate tools for navigating DOGE’s next major market chapter.
 Crypto Investing & Trading
 Crypto Investing & Trading
 Crypto Investing & Trading