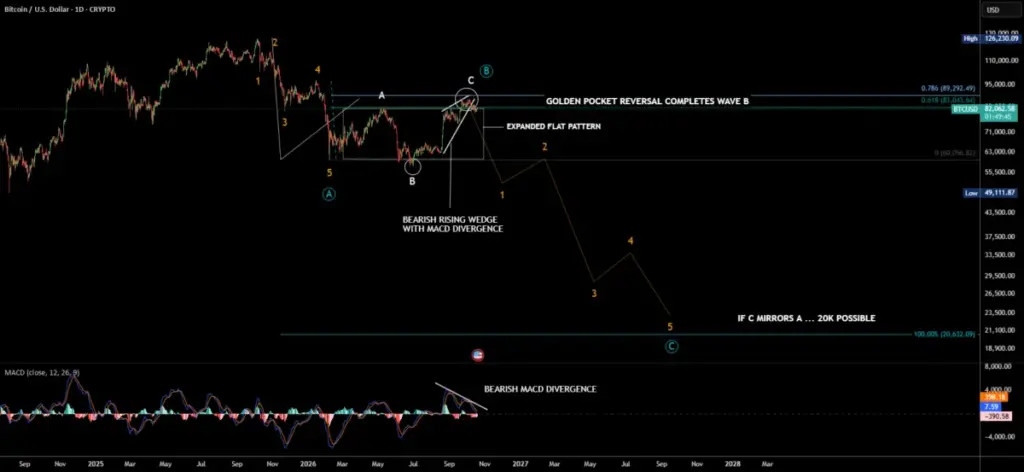
Financial market observers and technical analysts are closely monitoring the latest price action developments across cryptocurrency charts, where a completed five-wave downward movement appears to have finalized Wave A. This initial descent has set the stage for subsequent corrective structures that now suggest a larger bearish continuation may be underway. According to recent chart interpretations shared within trading communities, the market’s behavior over the past several sessions aligns with classic Elliott Wave principles, pointing toward a significant test of lower support levels as Wave C takes shape.
Following the initial five-wave move down that constituted Wave A, the market appeared to construct an Expanded Flat Pattern for Wave B. In technical analysis, an expanded flat is a type of corrective wave structure where the intermediate wave B retraces beyond the origin of the preceding wave, and wave C subsequently terminates beyond the end of wave A. In this specific instance, the corrective Wave B reversal notably occurred right at the golden pocket—a key Fibonacci retracement level typically situated between the 61.8% and 65% zones—drawn from the preceding wave 4 to wave 5 move. This precise rejection from a major Fibonacci confluence zone has added technical weight to the validity of the corrective pattern.
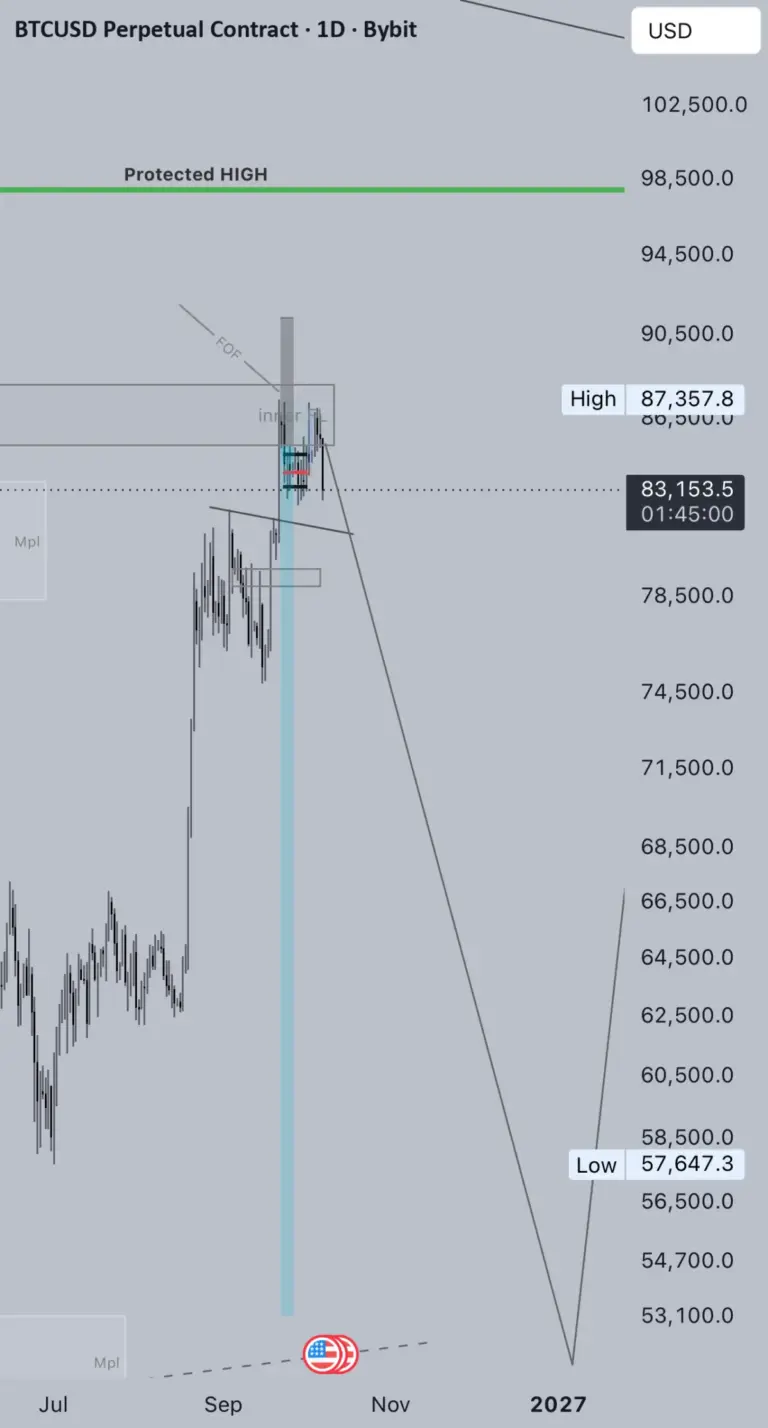
Building upon this structural setup, market participants are noting that Wave C down is likely starting now, underlined by a decisive break of a rising bearish wedge. A rising wedge is a chart pattern characterized by converging trend lines sloping upward, indicating a loss of momentum during an upward corrective phase within a broader downtrend. The breakdown from this rising wedge formation coincides neatly with persistent bearish divergence observed on the Moving Average Convergence Divergence (MACD) indicator. Bearish divergence occurs when the price makes higher highs or attempts a recovery while the MACD indicator records lower highs, signaling underlying weakness and exhaustion among buyers before a resumption of selling pressure.
In the framework of Elliott Wave theory, Wave C typically mirrors the characteristics of Wave A, frequently featuring a robust and impulsive five-wave move down. Because Wave C is driven by the primary trend direction, it often matches or exceeds the length and velocity of the initial downward impulse. When applying standard technical projection tools to the current chart setup, drawing a one-to-one Fibonacci extension from the peak and trough of Wave A down to the termination point of Wave B yields a precise technical downside target situated just north of the 20,000 threshold.
As traders and analysts evaluate these formations, market participants continue to emphasize the inherently volatile nature of digital asset trading and the necessity of robust risk management strategies when navigating complex technical environments.
Disclaimer
The information and publications are not meant to be, and do not constitute, financial, investment, trading, or other types of advice or recommendations supplied or endorsed by TradingView. Read more in the Terms of Use.
 Crypto Investing & Trading
 Crypto Investing & Trading
 Crypto Investing & Trading