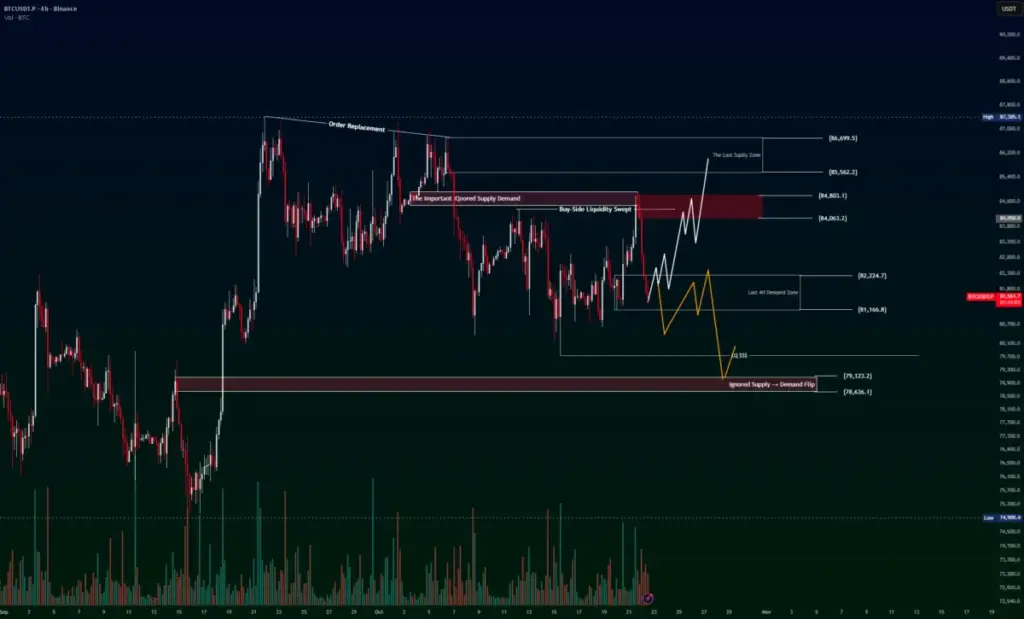
Bitcoin is currently navigating a critical juncture on its short-term charts, testing a decisive four-hour demand zone following a sharp and aggressive rejection from overhead supply. This pivotal area is expected to dictate the leading cryptocurrency’s near-term trajectory, determining whether the digital asset can orchestrate a volatile recovery rally or whether it will succumb to mounting selling pressure, extending its downward correction toward liquidity pools resting below the $79,000 threshold.
The unfolding price action highlights a delicate tug-of-war between market bulls and bears, with technical analysts closely monitoring how the asset reacts to key structural boundaries over upcoming four-hour candle closes.
Market Context and Recent Price Action
The roots of the current market test trace back to an initial liquidity sweep by Bitcoin buyers. Earlier in the cycle, BTC successfully drove prices upward to harvest buy-side liquidity situated just above the local high near $84,314. During this upward surge, the cryptocurrency traded directly into a heavy overhead supply zone spanning from $84,063 to $84,803.
However, bullish momentum stalled rapidly within this region. Buyers ultimately failed to establish market acceptance above that critical hurdle, triggering an immediate and aggressive response from sellers. The resulting rejection produced a strong bearish displacement across the charts, accompanied by a notable surge in selling volume that quickly erased the previous gains and shifted the short-term momentum firmly in favor of the bears.
Driven by this sudden wave of supply, Bitcoin’s price has now retreated all the way down to the $81,167 to $82,225 zone. This specific price corridor represents the final significant pocket of demand remaining within the current local pivot structure. Because the asset arrived at this vital area with substantial downside momentum, market participants are being cautioned against treating a simple, instantaneous touch of the zone as a guaranteed or confirmed market reversal. Instead, professional traders note that the actual price reaction and the subsequent four-hour candle closes will carry far more weight than a fleeting intrabar wick dipping below the boundary.
Scenario One: Demand Holds and Bitcoin Mounts a Volatile Recovery
The first primary path for the market relies on the defense of current price levels by active buyers. If bullish participants step in to absorb the remaining sell pressure, successfully defend the lower boundary at $81,167, and subsequently reclaim the upper boundary at $82,225, Bitcoin could lay the groundwork for a meaningful recovery phase.
Given the sheer velocity and aggression of the preceding downward move, analysts suggest that any ensuing recovery is likely to be characterized by high volatility rather than a smooth, linear climb. As the asset attempts to work its way back upward, it will immediately encounter its first major technical obstacle: the persistent supply zone resting between $84,063 and $84,803. This is the exact same geographical price region from which the latest wave of bearish displacement originated, meaning it will likely house lingering limit sell orders and cautious trapped longs looking to exit at break-even.
A rejection at this initial supply barrier could easily send Bitcoin tumbling back toward the current demand zone to retest lower supports. Conversely, if buyers manage to push through this resistance and establish clear, definitive four-hour market acceptance above the $84,803 mark, market attention will naturally shift toward the final layer of overhead supply located between $85,562 and $86,700.
A decisive breakout followed by a successful structural retest above the upper bound of $86,700 would substantially weaken the broader bearish market structure. Such a development would expose the local high of $87,385, while opening the door for a potential march toward the highly anticipated psychological milestone of $90,000.
Within this bullish framework, key technical confirmation would arrive upon successfully reclaiming the $82,225 level and subsequently forming a higher low situated securely above the primary demand zone. On the other hand, bullish invalidation would occur if the market experiences sustained four-hour acceptance below $81,167, particularly if any subsequent relief rally fails to reclaim the newly broken zone.
Scenario Two: Demand Is Consumed and the Downtrend Extends
Alternatively, the bearish scenario stands ready to activate if repeated tests of the current support deplete the remaining buy orders trapped inside the demand zone. If selling pressure overwhelms demand and Bitcoin produces a decisive four-hour candle close below $81,167, the door opens for an extended corrective phase.
Market analysts point out that a breakdown through this crucial level may not unfold in a straight, uninterrupted line. In the wake of such an aggressive sell-off, historical price action suggests that Bitcoin could initially produce a localized relief bounce, or temporarily retest the newly broken demand zone from underneath as resistance, before ultimately resuming its downward trajectory.
Should the bearish thesis play out fully, the immediate downside objectives come into focus across lower technical levels. The first major target is represented by the pool of sell-side liquidity resting near $79,700. This liquidity pocket is expected to act as a powerful price magnet, potentially pulling Bitcoin downward toward the lower structural boundary.
Beyond that lies the $79,123 to $78,636 demand-flip zone. A sharp sweep below the $79,700 liquidity cluster directly into this deeper demand-flip zone could spark another corrective bounce. However, veteran market observers emphasize that any definitive bullish reversal should only be entertained after clear, unmistakable confirmation signals materialize on the charts.
For this bearish sequence to be officially confirmed, the market requires a confirmed four-hour close below $81,167, followed immediately by a failed attempt by bulls to reclaim the lost territory. Conversely, this bearish outlook would be entirely invalidated if Bitcoin engineers a strong, impulsive recovery above $82,225 and successfully establishes that same level as reliable price support.
Final Technical Outlook
At the current juncture, Bitcoin is trading at what is widely considered the most important technical decision point on the short-term chart. The coming hours and days will prove critical as the market evaluates the strength of the active participants.
Successfully defending and reclaiming the $81,167 to $82,225 demand zone would provide the necessary breathing room for a broader recovery rally targeting the $84,063 to $84,803 supply band, with a potential secondary extension toward the $85,562 to $86,700 region. On the flip side, a failure to hold this vital line in the sand would surrender control to the bears, instantly exposing the liquidity pool near $79,700 and the lower $79,123 to $78,636 demand-flip zone.
As always in digital asset markets, these projected paths represent potential behavioral reactions rather than exact, predetermined price trajectories. Vigilant monitoring of candle closes, shifting market structures, and the behavior of price upon touching each designated zone remains essential for navigating the ongoing volatility. This overview is provided strictly for educational and informational purposes and does not constitute formal financial or investment advice.
 Crypto Investing & Trading
 Crypto Investing & Trading
 Crypto Investing & Trading