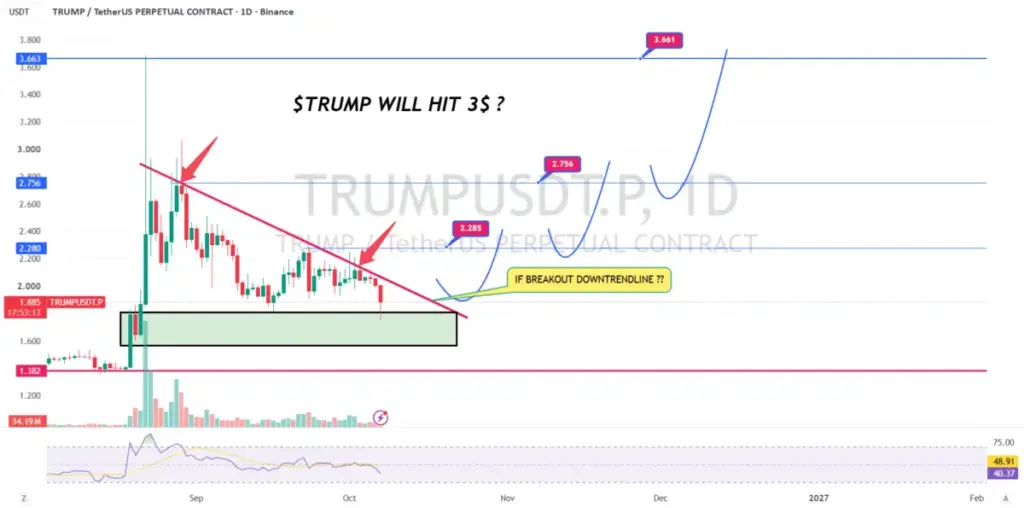
Cryptocurrency market participants are closely monitoring price action surrounding the asset known by the ticker symbol $TRUMP, as technical indicators suggest the token is approaching a critical juncture. Market analysis shared across trading platforms highlights that the price is currently sitting directly beneath a prominent downtrend line, a technical boundary that has commanded the attention of chart watchers and short-term traders alike.
According to technical observations circulating within the trading community, the unfolding price structure for $TRUMP is beginning to capture broader interest due to its proximity to this ongoing downward-sloping barrier. Analysts tracking the setup note that while the asset has faced sustained downward pressure over preceding sessions, the current consolidation phase near the trendline presents a pivotal testing ground for both buyers and sellers.
The primary catalyst being watched by market observers is the emergence of a decisive bullish candle capable of decisively piercing the existing trendline. However, market participants emphasize that a mere momentary spike above the line will not suffice to confirm a structural shift. Instead, analysts are prioritizing the requirement that the asset not only breaks the barrier but also successfully holds above it on subsequent price bars. Only through a sustained hold above the downtrend line would the broader bullish setup begin to gain technical validity and attract follow-through momentum from market participants.

Should the bulls manage to orchestrate a confirmed breakout accompanied by robust trading volume and encouraging momentum indicators, technical projections point toward a series of successive upside targets. The immediate levels identified by market watchers begin with an initial milestone at $2.285, followed by subsequent resistance checkpoints at $2.756 and $3.00. Beyond the psychological $3 threshold, analysts have mapped out an extended higher target situated at $3.661, which represents a more substantial technical extension should buying pressure accelerate significantly.
Conversely, market commentary underscores the continued relevance of crucial downside protection areas in the event that the breakout attempt fails. The price zone spanning from $1.58 to $1.78 remains highlighted as a vital support region where historical buyer interest has previously congregated. Market observers point out that maintaining this support band is essential for preserving the broader structural integrity of the chart, ensuring that any rejection at the downtrend line does not trigger a more destructive downward spiral.
While the prospect of a move toward the $3 mark and beyond generates discussion among market participants, analysts maintain a cautious and analytical stance, reiterating that a higher price target is by no means guaranteed at this preliminary stage. The consensus among technical watchers remains strictly focused on the immediate prerequisite: observing how the asset handles the confluence of the downtrend line and the incoming volume. If market bulls are able to demonstrate sufficient strength, adequate momentum, and the necessary volume to break and hold above the barrier, market dynamics surrounding $TRUMP could experience notable shifts in a relatively short timeframe.
 Crypto Investing & Trading
 Crypto Investing & Trading
 Crypto Investing & Trading