Ethereum (ETHUSD) is currently navigating a pivotal phase on its weekly timeframe, trading near crucial support levels that could establish the foundation for a significant market accumulation and a major bullish reversal. Following an extended period of heightened market volatility and persistent corrective price action, the world’s leading smart-contract platform finds itself at a technical crossroads that is likely to dictate its predominant trend trajectory for the months ahead.
Market observers and technical analysts are closely monitoring current price levels as Ethereum hovers near the $2,400 mark, descending deeper into a broader zone of historical interest. While short-term sentiment remains tempered by broader macroeconomic headwinds and crypto market fluctuations, analytical assessments suggest that the current price region presents the early building blocks for a sustainable trend reversal. However, realizing this optimistic outlook depends heavily on whether buyers can successfully defend key structural boundaries and trigger the necessary volume-backed momentum to shift the weekly market structure.
Identifying the Critical Support Zone: The $2,000–$2,200 Demand Area
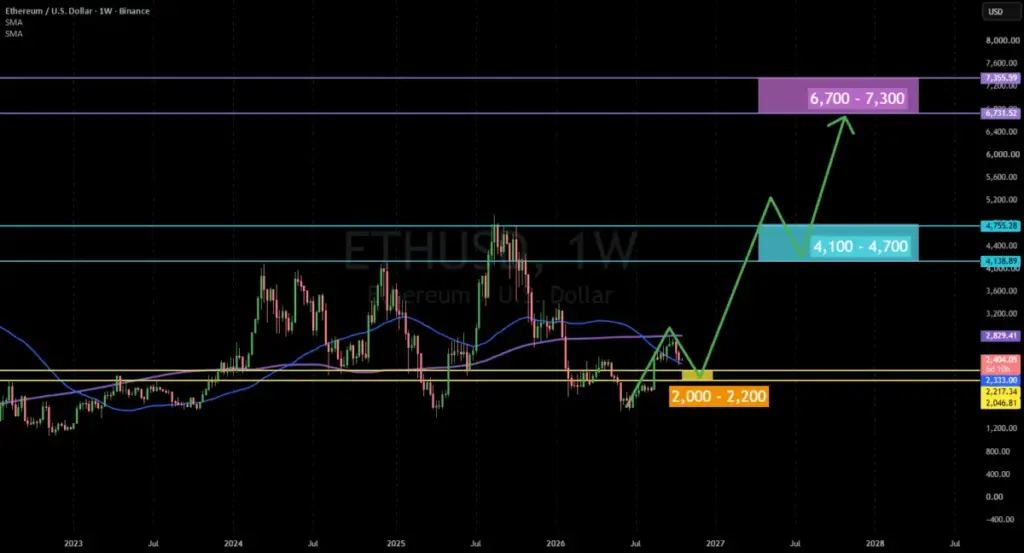
At the heart of the current bullish thesis is a well-defined technical demand zone stretching between $2,000 and $2,200. This highlighted area on the weekly chart represents a significant historical inflection point, having previously acted as a springboard for strong buying pressure and accumulation phases.
For the bullish reversal scenario to remain viable, Ethereum must successfully retest this region and demonstrate a clear resurgence of buyer interest. Technical confirmation of this support holding is not merely a matter of touching the price level; it requires a confluence of supportive market behaviors on the weekly timeframe. Analysts are looking for distinct price rejection wicks off the $2,000 to $2,200 floor, which would indicate that large-scale participants are stepping in to absorb selling pressure. Furthermore, market structure shifts—specifically the formation of higher lows followed by a subsequent higher high—will be essential to prove that the downtrend has exhausted itself.
Equally important is the behavior of trading volume during any potential recovery candles. Rising buying volume alongside sustained weekly closes above the support zone would signal genuine accumulation rather than a temporary dead-cat bounce. Conversely, a decisive, high-volume weekly breakdown below the $2,000 threshold would invalidate this optimistic setup, exposing Ethereum to the probability of a much deeper correction toward previous multi-month swing lows and fundamentally altering the medium-term market outlook.
The Path to Primary Recovery: Targeting $4,100–$4,700
Should Ethereum successfully establish a definitive macro bottom within the $2,000 to $2,200 accumulation band and build sustainable bullish momentum, the focus will naturally shift toward higher overhead resistance levels. The primary target for a completed bullish recovery cycle lies between $4,100 and $4,700.
Reaching this formidable resistance zone would represent a substantial percentage gain from Ethereum’s current trading range around $2,400, serving as a comprehensive market recovery. However, the $4,100 to $4,700 band is not expected to yield easily. This region marks a major technical hurdle where historical selling pressure, long-term profit-taking, and trapped liquidity are likely to converge.
Extended technical projections allow for the possibility of a temporary market overshoot or breakout above the $4,700 ceiling, which could be followed by a classic retest of the $4,100 region to confirm it has successfully flipped from former resistance into a reliable new support floor. The market’s ability to maintain structural integrity above this previous resistance band will be the ultimate litmus test for whether Ethereum can sustain its upward trajectory into unchartered territory.
The Long-Term Expansion Hypothesis: Reaching for $6,700–$7,300
Looking further ahead into a multi-year horizon, a more ambitious bullish scenario maps out a potential price expansion toward the $6,700 to $7,300 range. It is crucial to emphasize that this higher bracket represents a conditional long-term projection rather than an immediate or guaranteed price target.
For Ethereum to mount a realistic challenge against these elevated valuations, several macroeconomic and network-specific conditions must align harmoniously. First and foremost, the broader cryptocurrency market would require a sustained, multi-month bullish market structure on the weekly chart, accompanied by robust capital inflows. Additionally, Ethereum’s performance relative to Bitcoin, commonly tracked via the ETH/BTC trading pair, would need to show significant relative strength, signaling that capital is rotating actively into the ecosystem.
Beyond purely technical considerations, fundamental drivers would play an instrumental role in facilitating such a dramatic expansion. Increased institutional participation, broader adoption of decentralized finance (DeFi), rising volumes in stablecoins, and the ongoing tokenization of real-world assets (RWAs) on the Ethereum network would all contribute to organic ecosystem demand. Furthermore, a general market-wide rotation of capital into alternative cryptocurrencies would provide the necessary liquidity tide to lift Ethereum toward its upper projected boundaries. A confirmed breakout and successful subsequent retest of the $4,100 to $4,700 region would serve as the essential stepping stone to validate this ambitious thesis.
Ethereum’s Role as a Catalyst for Altseason Dynamics
Beyond its individual price action, Ethereum frequently functions as a broader macroeconomic bellwether for the rest of the digital asset market, often setting the tone for capital rotation cycles. Historically, shifts in market momentum often begin when Bitcoin enters a period of localized price consolidation or range-bound trading.
If this consolidation coincides with a strengthening ETH/BTC trading pair and a gradual decline in Bitcoin market dominance, it has historically created an optimal environment for a broader altcoin recovery, commonly referred to as an "altseason." Given Ethereum’s towering status as the foundational layer for decentralized finance, Layer 2 scaling networks, institutional staking products, and tokenized financial infrastructure, it remains the most critical asset to monitor during any major capital rotation phase.
Nevertheless, healthy ecosystem metrics and growing utility do not automatically translate into proportional, immediate price appreciation. Market participants continue to watch closely to see whether the underlying fundamental narrative will be reinforced by tangible, volume-backed price action across major exchanges.
Weighing the Bullish and Bearish Scenarios
As market participants evaluate their exposure, the current technical landscape presents two clearly divergent paths based on how price reacts to key structural levels.
In the preferred bullish scenario, Ethereum successfully defends the $2,000 to $2,200 demand zone, establishes a clear weekly higher-low accumulation structure, and gradually grinds its way upward toward the primary $4,100 to $4,700 resistance band. A high-volume sustained breakout above that zone would clear the path for a long-term expansion toward the extended $6,700 to $7,300 target range.
On the other end of the spectrum, the bearish scenario hinges upon a loss of the critical $2,000 support area on a sustained weekly closing basis. Such an event would completely invalidate the current support-based reversal setup, shattering investor confidence at crucial technical boundaries and exposing the asset to significantly lower historical price regions.
With technical indicators pointing toward a critical inflection point, the overarching market outlook remains conditionally bullish, anchored entirely by the integrity of the $2,000 to $2,200 demand region. While the projected market structure hints at a generational long-term accumulation opportunity for patient participants, definitive market confirmation remains an absolute prerequisite before treating higher upside targets as actionable trading objectives.
Analysis provided by AKMelytics, focusing on macroeconomic market intelligence and technical price action. This overview is intended strictly for educational purposes and should not be construed as formal financial advice. Given the inherent volatility of digital asset markets, all projected targets remain conditional and subject to broad systemic market risks.
 Crypto Investing & Trading
 Crypto Investing & Trading
 Crypto Investing & Trading