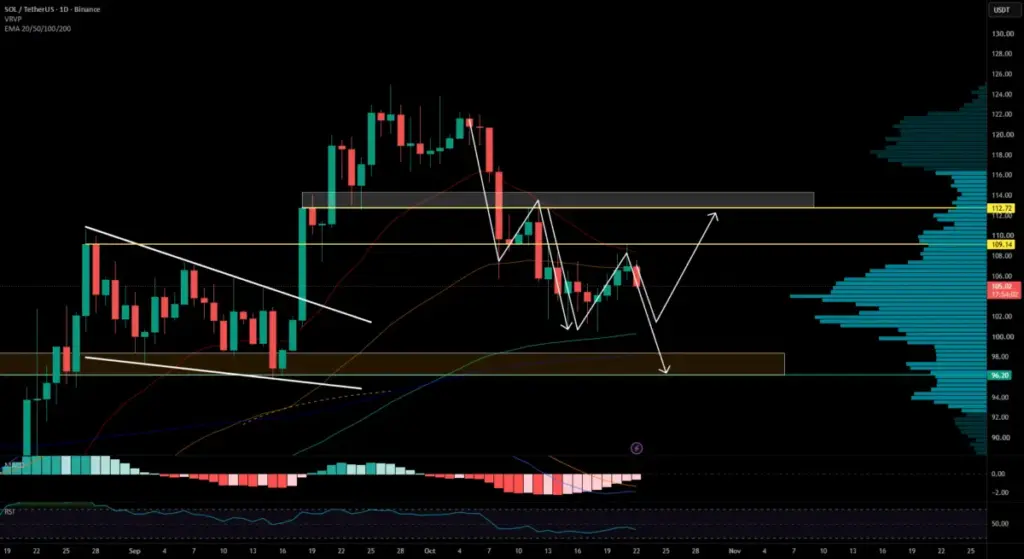
Hello TradingView community, and welcome to the latest market update from the Bitbull team. Solana (SOL) has continued to demonstrate high volatility, playing out the short confirmation from our previous analysis exactly as anticipated by market observers. Following a definitive rejection at the crucial 112 USD zone, the prominent smart contract platform’s native token broke down cleanly, ultimately sliding to reach our projected downside target sitting right around the 100 USD threshold. As trading activity persists across major global cryptocurrency exchanges, SOL is currently changing hands at approximately 104.93 USD, reflecting a moderate yet notable decline of 1.91 percent on the day.
This recent price action follows a familiar blueprint for technical traders monitoring the digital asset markets. After attempting a brief and somewhat fragile recovery over the past few days, SOL now finds itself trapped in a renewed potential short confirmation setup. The broader market context reveals that the asset’s price faced a sharp rejection once again, this time failing to sustain momentum above the 109 USD mark. Compounding this bearish development is the overlying Exponential Moving Average (EMA) band, which is currently displaying a textbook technical pattern: the characteristic pullback into a previously broken market structure is failing entirely, allowing sellers to step back in and firmly retake control of the order books.
Should this prevailing bearish momentum persist, market analysts at Bitbull project that the next logical downside target for Solana would be situated around the 97 USD region. This specific price level marks a critically important support barrier on the daily chart. Furthermore, it represents a high-interest zone backed by a solid volume basis clearly visible in the Volume Profile Visible Range (VRVP). Adding confluence to this technical outlook, the 97 USD zone also neatly coincides with the key 200 EMA, making it a pivotal battleground for bulls and bears alike over the upcoming trading sessions.
Despite the dominant downward pressure, the analytical framework must account for alternative market trajectories. There remains a viable, albeit challenging, counter-scenario for the asset. Should SOL manage to find resilient support once more around the psychological 100 USD level, traders could potentially witness the formation of a local double bottom pattern. However, realizing this bullish alternative would require a significant injection of serious buying momentum—a market dynamic that has been largely absent during recent sessions. The recovery attempts mounted by buyers thus far have simply proven too weak to meaningfully challenge or crack the formidable overhead EMA band. Without substantial institutional or retail buyers stepping in with aggressive volume, the overarching technical picture remains decidedly bearish.
A closer examination of the underlying technical indicators reinforces this cautious stance across multiple timeframes. The Moving Average Convergence Divergence (MACD) indicator on the daily chart remains firmly entrenched in negative territory. While the MACD histogram is currently displaying initial, tentative signs of flattening out following the recent bounce, a confirmed bullish crossover is still nowhere in sight, leaving trend-following traders on the sidelines. Meanwhile, the Relative Strength Index (RSI) sits comfortably in weak territory well below the neutral midline. Notably, the RSI barely utilized the recent market recovery to reset its values, which carries a clear technical implication: there is still ample room for further downside movement before the asset approaches genuinely oversold conditions.
Happy trading from your Bitbull team.
Disclaimer: The information and publications provided in this report are not meant to be, and do not constitute, financial, investment, trading, or other types of advice or recommendations supplied or endorsed by TradingView. Readers are encouraged to review the full terms and policies regarding investment decisions and market participation.
 Crypto Investing & Trading
 Crypto Investing & Trading
 Crypto Investing & Trading