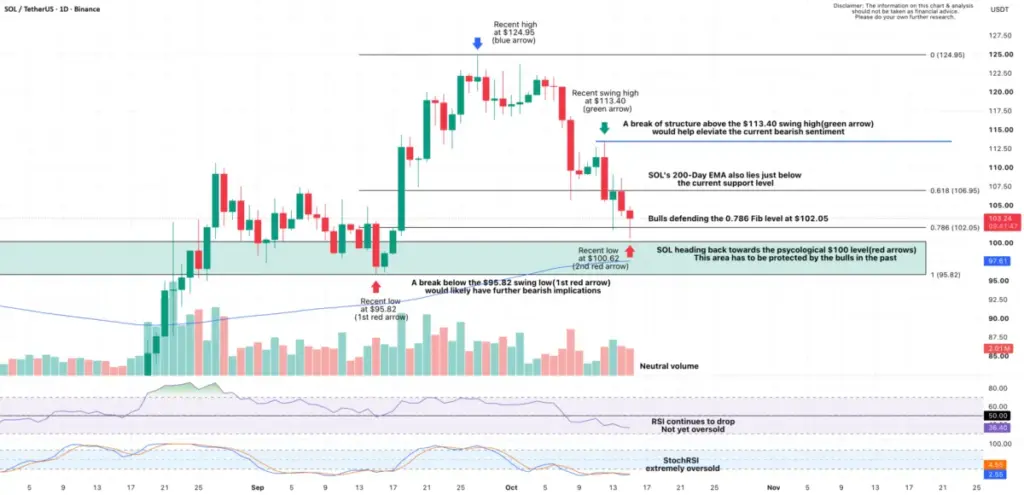
Solana has entered a precarious technical phase following a sharp and decisive reversal from its recent local high of $124.95. Throughout the recent market decline, persistent selling pressure has dominated price action, with sellers maintaining firm control over the short-term trajectory. Market participants have watched closely as multiple recovery attempts stalled, reinforcing a broader bearish sentiment that has cast a shadow over the asset’s immediate prospects.
The primary catalyst for this deteriorating short-term structure was the market’s inability to reclaim the crucial $113.40 swing high. When buyers failed to breach this threshold, it signaled a continuation of the downward momentum, leaving market participants struggling to establish any meaningful recovery platform. This failure has emboldened sellers, keeping Solana anchored near the lower boundaries of its current trading range and forcing analysts to reevaluate the strength of foundational support levels.
Attention has now turned squarely toward the 0.786 Fibonacci retracement level, which sits at $102.05. Bulls are currently attempting to mount a defense around this critical psychological and technical marker. Early indications show that the price has slipped slightly into this zone, prompting some short-term buying interest as traders look for value. However, market observers note that this response has lacked the aggressive volume typically associated with a robust trend reversal. If this initial buying interest fades, continued weakness would significantly increase the probability of a downward extension toward the psychological $100 threshold, a historical region where buyers have previously stepped in to absorb excess supply.
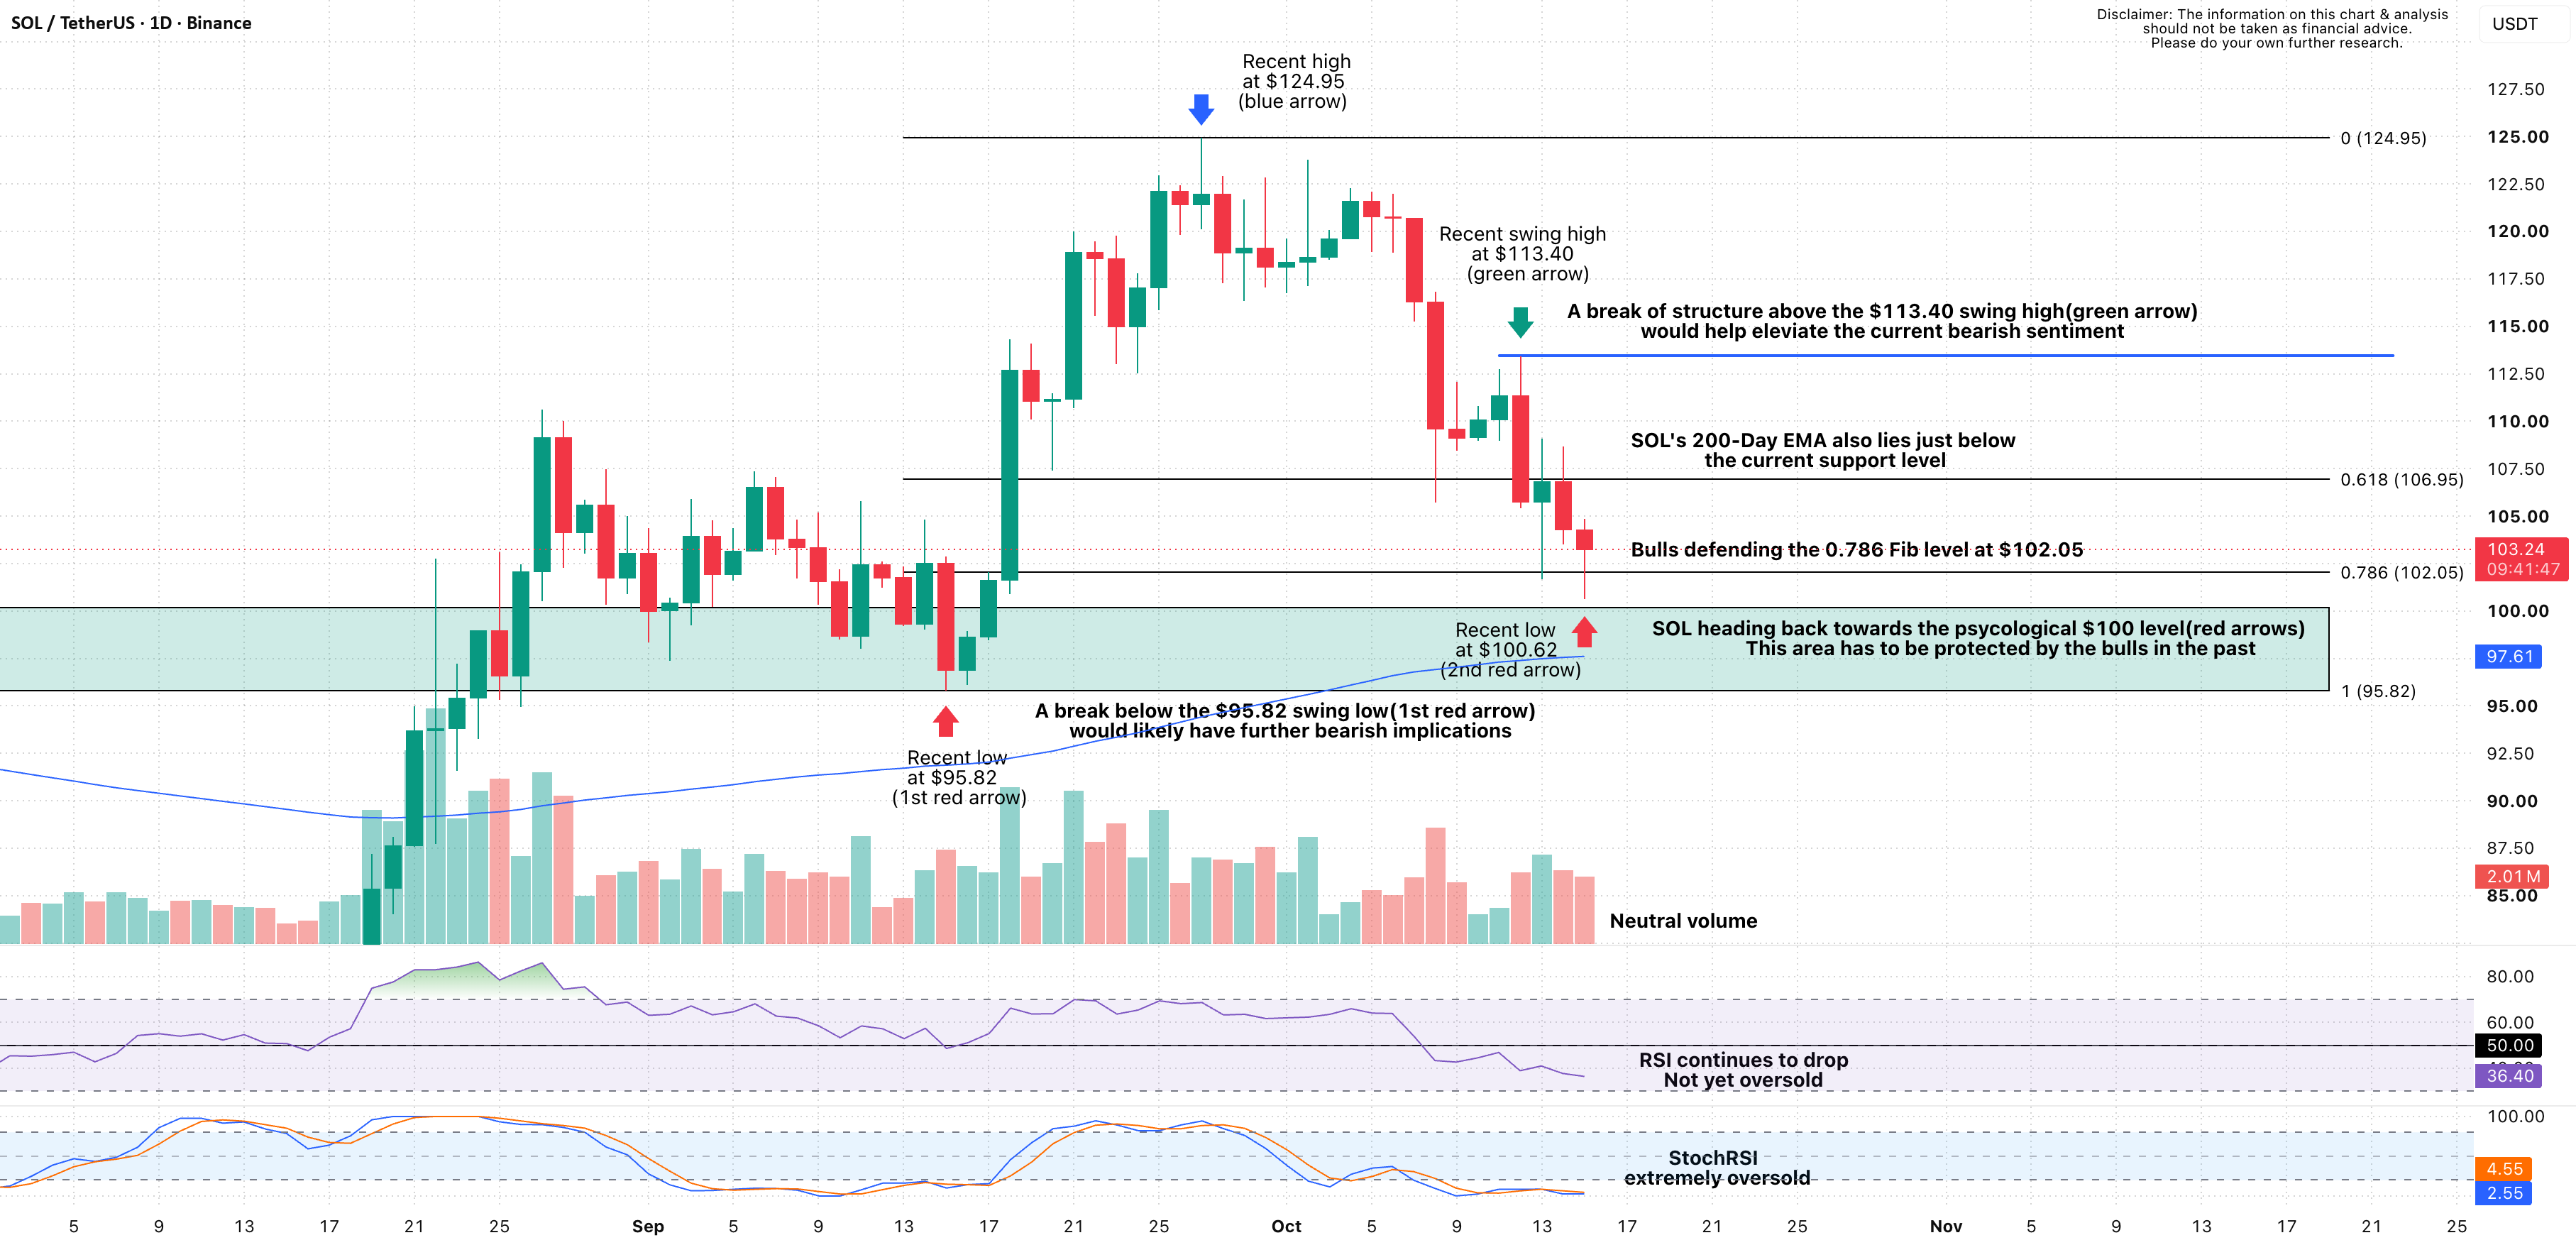
Compounding the importance of this lower boundary is the presence of the 200-day Exponential Moving Average (EMA), which currently resides around the $97.59 mark. The convergence of the 200-day EMA with the broader support zone between $95.82 and $100 creates a formidable confluence of technical backing. This multi-layered support area has historically attracted significant buying interest, serving as a springboard for previous upward rallies. Nevertheless, market analysts caution that a convincing, high-volume break below the $95.82 floor would represent a severe deterioration in the daily market structure, potentially inviting deeper corrections over the medium term.
Underpinning this price action is a firmly bearish momentum profile. The Relative Strength Index (RSI) continues to print a downward trajectory, lingering below the neutral 50 centerline without yet touching oversold territory. This ongoing descent suggests that there remains ample room for further downside movement before the asset reaches exhaustion. Meanwhile, the Stochastic RSI indicator has already plunged into extremely oversold conditions. While this extreme reading signals that the market is heavily depressed in the very short term, technical analysts emphasize that an oversold Stochastic RSI alone provides little concrete evidence that the current decline has fully run its course.
Interestingly, underlying trading volume has offered relatively little confirmation of aggressive distribution during the sell-off. Despite the persistent downward pressure, volume remains relatively neutral, indicating that the decline is not currently being fueled by massive panic selling or heavy institutional unloading. While this absence of aggressive distribution may offer a glimmer of hope to optimistic traders, market participants agree that a much stronger, volume-backed buying response is required around the approaching support zone to validate any potential turnaround. Without such confirmation, the path of least resistance continues to lean toward the downside.
The broader technical picture leaves Solana navigating a delicate tightrope. Following the sharp rejection at $124.95 and the subsequent failure to mount a recovery above $113.40, the short-term outlook remains decidedly defensive. With the asset hovering near the 0.786 Fibonacci retracement level, all eyes remain fixed on the pivotal $100 psychological area and the nearby 200-day EMA. For the market sentiment to shift away from its current bearish bias, bulls must urgently marshal their resources to defend the $95.82 to $100 support zone. Only by successfully establishing a firm base at these levels can buyers begin the arduous process of rebuilding the damaged short-term market structure.
 Crypto Investing & Trading
 Crypto Investing & Trading
 Crypto Investing & Trading