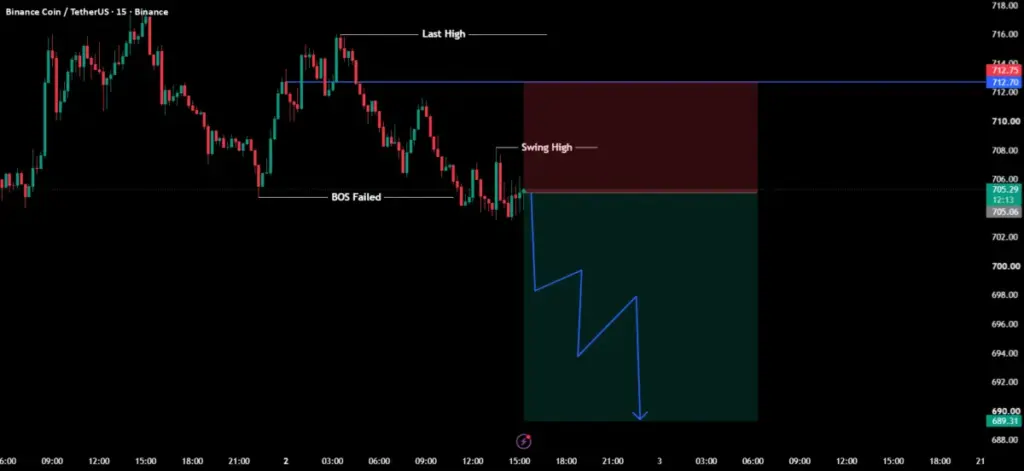
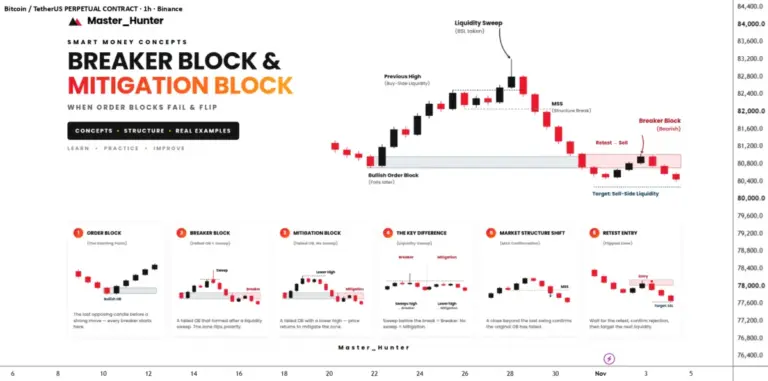
The cryptocurrency market continues to experience dynamic shifts in momentum, with recent technical developments pointing toward renewed downward pressure for Binance Coin against Tether. Following a sharp and notable decline from a previously established market high, price action has revealed significant structural vulnerabilities. Technical analysts monitoring the asset have identified a failed break of structure, commonly referred to in technical trading circles as a BOS failed. This critical development signals a distinct lack of follow-through from market buyers and underscores a growing underlying weakness at higher valuation levels.
In the wake of this structural failure, subsequent price behavior has reinforced the prevailing bearish bias. The asset recently carved out a fresh swing high that settled notably lower than the previous market peak. This inability to reclaim higher ground was quickly followed by a test of local support levels, confirming that persistent bearish order flow remains firmly in control of the market dynamics. Market participants tracking these movements are observing how supply and demand zones are currently interacting, particularly as the asset struggles to maintain its footing near critical local thresholds.

The execution strategy emerging from these technical conditions anticipates a continuation of the downward trajectory along a projected zigzag path. Analysts and market observers focusing on this setup are increasingly eyeing sell-side liquidity pools that lie beneath the current price structure. As the market navigates a phase of local consolidation, the primary focus centers on an impending breakdown of these tight ranges, which could potentially accelerate the downward momentum and unlock further downside targets.
This technical outlook is part of a broader analytical framework frequently utilized by traders examining assets like BNBUSDT through the lens of supply and demand, support and resistance, and comprehensive trend analysis. Such methodologies help market participants map out potential reaction zones and liquidity pools, offering a structured way to interpret complex price movements without relying on subjective speculation.
As traders and analysts evaluate the implications of these technical signals, platforms hosting these insights maintain strict operational policies regarding financial information. Standard industry disclaimers emphasize that information and publications of this nature are not intended to constitute, and do not constitute, financial, investment, trading, or other types of advice or recommendations. Major analytical platforms, including TradingView, explicitly state that users should review relevant terms of use regarding investment decisions and market engagement, ensuring that analytical content is consumed purely for informational and educational perspectives rather than as direct directives for financial action.
 Crypto Investing & Trading
 Crypto Investing & Trading
 Crypto Investing & Trading