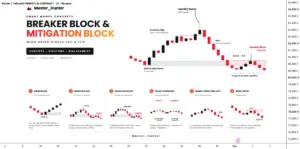
In the fast-paced world of technical analysis, encountering a broken setup is a daily occurrence for market participants. Traditional retail traders frequently watch in frustration as a carefully identified Order Block—the foundational anchor of institutional footprint mapping—fails to hold its ground. When price forcefully breaches what was supposed to be a robust zone of support or resistance, the conventional reaction is to accept the loss, close the position, and step away from the charts. However, professional market analysts and institutional participants view these apparent failures through an entirely different lens. In the realm of smart money concepts, a failed Order Block does not simply disappear or lose its relevance; instead, it undergoes a transformation, flipping its directional polarity to present a fresh, highly lucrative trading opportunity.
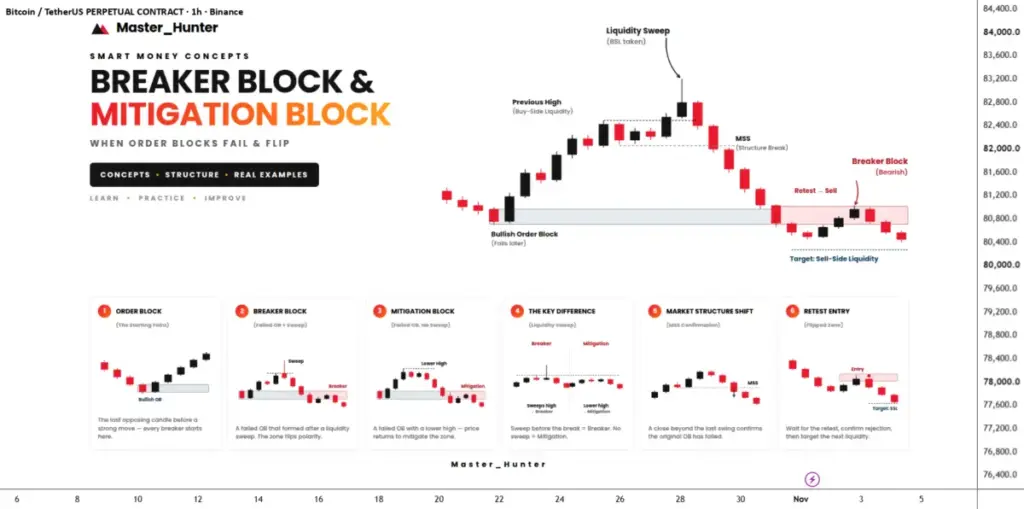
To understand this phenomenon, traders must first examine the origin of every Breaker and Mitigation Block. These advanced structural elements begin their lifecycle as standard Order Blocks, defined as the final opposing candle that precedes a significant impulsive move in price. On a typical chart, a bullish Order Block materializes during a downward candle right before a powerful upward rally, signaling aggressive buying interest. While everything initially appears bullish, structural dynamics can shift quickly if subsequent price action reverses and closes aggressively below the established zone. When this failure occurs, the future utility of the zone hinges on a singular, critical market dynamic: whether institutional liquidity was swept prior to the structural break.
The distinction between a Breaker Block and a Mitigation Block rests entirely on this mechanical nuance. A Breaker Block forms when a failed Order Block is preceded by a clear liquidity sweep, meaning the market aggressively ran through previous swing highs or lows to capture resting stop-loss orders before reversing direction. In this scenario, a failed bullish Order Block transforms into a potent bearish Breaker, while a failed bearish Order Block converts into a reliable bullish Breaker. Former support effectively turns into resistance as the institutional orders that once defended the level are now positioned to defend the opposite side of the market.
Conversely, a Mitigation Block represents a structurally weaker setup characterized by the absence of a prior liquidity sweep. In these instances, price generates a lower high rather than taking out an older high before breaking decisively through the Order Block. When price eventually returns to this specific zone at a later time, it does so merely to mitigate the remaining unhedged positions left behind by institutional participants who were unwinding exposure, rather than aggressively hunting stops. Recognizing this difference allows experienced traders to gauge the conviction and sustainability of the subsequent price movement.
The validation of either pattern relies heavily on a Market Structure Shift. This definitive confirmation occurs when price closes firmly beyond the most recent swing point, proving beyond doubt that the original Order Block has indeed failed. Experienced market participants emphasize that a mere wick piercing through the zone does not constitute a valid failure or a structural shift. Without a confirmed closing break, the integrity of the zone remains intact for its original purpose, rendering any attempt to trade a flip premature and hazardous.
Once a valid Market Structure Shift confirms the failure of the Order Block and the presence of a flipped zone, traders refrain from chasing the initial breakout. Instead, patience dictates waiting for price to retrace toward the newly minted Breaker or Mitigation Block. Upon arrival at this retested zone, market participants look for classic signs of rejection, such as a prominent pin bar, a strong engulfing candle, or a localized change of character on a lower timeframe, before targeting the next logical liquidity pool across the chart.
The mechanics of executing around a Breaker Block require meticulous risk management and precise structural alignment. A textbook example of this dynamic unfolds when a bullish Order Block is established between established parameters, such as 1.0850 and 1.0880. If price subsequently surges to sweep external liquidity at a higher level, such as 1.1005, before breaking internal structure and closing firmly below the original Order Block, the zone officially flips into a bearish Breaker. In such a scenario, a short entry during the subsequent retest near 1.0865 would typically be managed by placing a protective stop loss just beyond the outer boundary of the Breaker, safeguarding against unexpected market volatility.
Risk parameters for these setups are generally calibrated to align with individual account risk tolerance, such as risking a fractional percentage of total capital. Position scaling strategies often involve taking partial profits at predetermined structural milestones, such as achieving favorable risk-to-reward ratios, while simultaneously shifting the stop loss to breakeven once the initial profit target is secured. This systematic approach allows traders to capitalize on the residual momentum of the flipped zone while mitigating downside exposure should the broader market trend resume unexpectedly.
Ultimately, navigating the complexities of institutional order flow requires shifting one’s perspective away from rigid retail expectations and toward the fluid mechanics of market structure. A failed Order Block serves as a valuable narrative tool rather than a definitive endpoint, signaling a dramatic shift in institutional intent. By carefully observing whether liquidity was swept prior to the structural break, traders can effectively distinguish between high-probability Breaker Blocks and weaker Mitigation setups, transforming initial losses into disciplined, strategic opportunities.
 Crypto Investing & Trading
 Crypto Investing & Trading
 Crypto Investing & Trading