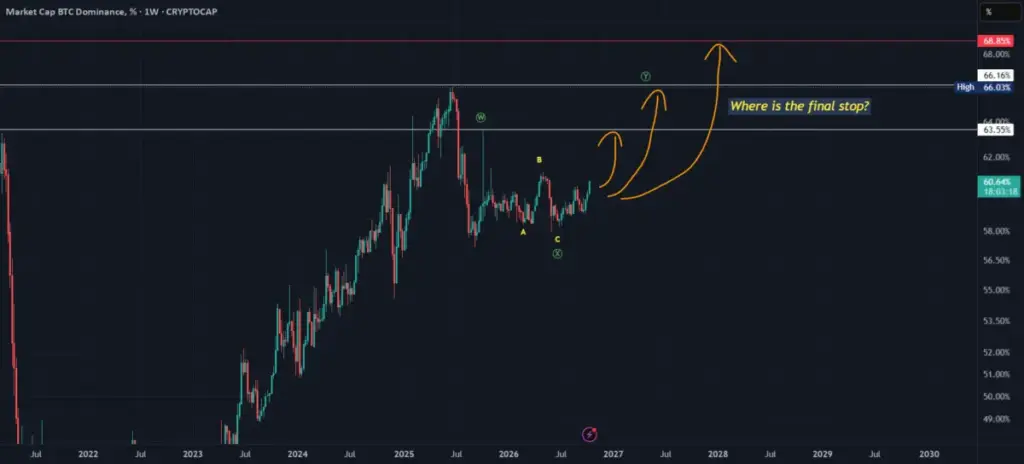
Recent technical observations in the cryptocurrency markets suggest that a complex price action sequence has unfolded, bringing digital assets into what analysts identify as a final upward wave following an intricate corrective phase. According to market analysts examining recent structural developments, the completion of a triple correction within a preceding flat pattern has cleared the path for the current bullish momentum. However, as prices continue to push higher, market participants are increasingly focused on identifying the precise boundaries where this terminal wave might exhaust its momentum.
The discussion surrounding the current market trajectory centers heavily on classical technical analysis principles, particularly Elliott Wave theory and trend analysis. In previous sessions, price action demonstrated a prolonged consolidation phase characterized by a flat correction structure, which was further complicated by a triple combination corrective pattern. This type of formation typically tests the patience of market participants, as it moves sideways and creates overlapping price action that makes immediate directional bias difficult to determine.

With that corrective phase now firmly in the rear-view mirror, the market has transitioned into what technical analysts classify as the final upward wave of the sequence. This phase of the wave count is often marked by renewed impulsive behavior, drawing in momentum traders and pushing valuations closer to local resistance thresholds. Nevertheless, the primary question occupying technical analysts and active market observers is not whether the wave is occurring, but rather where it will ultimately terminate.
Determining the exact ceiling of a final upward wave requires a careful examination of historical price nodes, volume profiles, and multi-timeframe resistance zones. As the asset moves upward, it approaches several layers of overhead supply where sellers previously stepped in to reverse the trend. Market watchers note that it will take time for price action to fully interact with these technical barriers. The critical event to monitor will be how the asset reacts upon colliding with these designated resistance areas, as this interaction will likely dictate whether the market undergoes a decisive rejection or manages to break through the last established peak.
Breaking through the final peak prior to the onset of the next major correction remains the ultimate objective for bullish market participants. A successful breakthrough would signal strong underlying demand and invalidate bearish reversal theories, potentially extending the broader macro trend. Conversely, a failure at these key technical thresholds could trigger the anticipated major correction, resetting market sentiment and clearing out excessive leverage accumulated during the final wave.
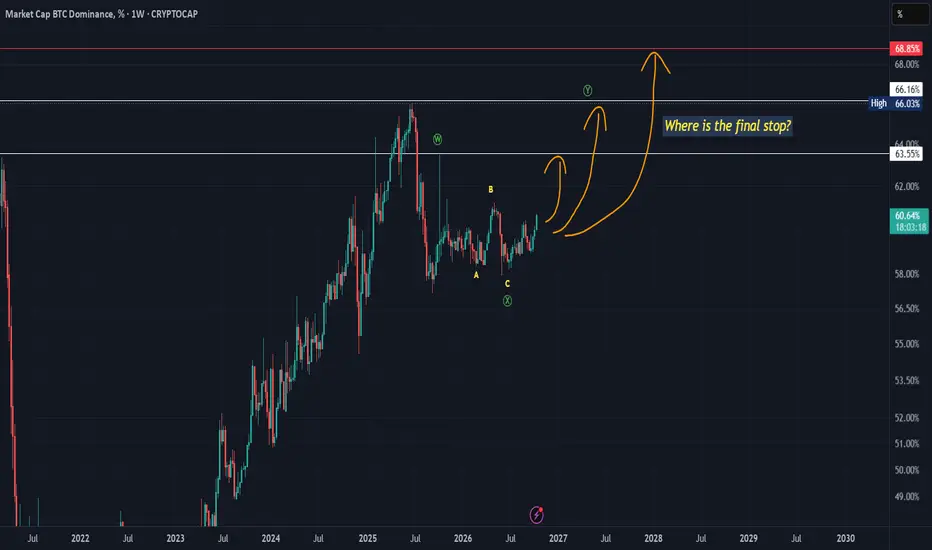
The ongoing technical evaluation underscores the inherent complexity of navigating market cycles using advanced wave principles. While the immediate structure points to continued upward movement, the presence of multiple overhead resistance zones serves as a reminder of the market’s dynamic nature. Analysts continue to monitor these developments closely, comparing current chart formations against established historical patterns to gauge the strength and durability of the ongoing trend. As the market progresses through these critical price levels, further clarity will emerge regarding which specific resistance zone possesses the strength to halt the advance and initiate the next structural phase.
 Crypto Investing & Trading
 Crypto Investing & Trading
 Crypto Investing & Trading