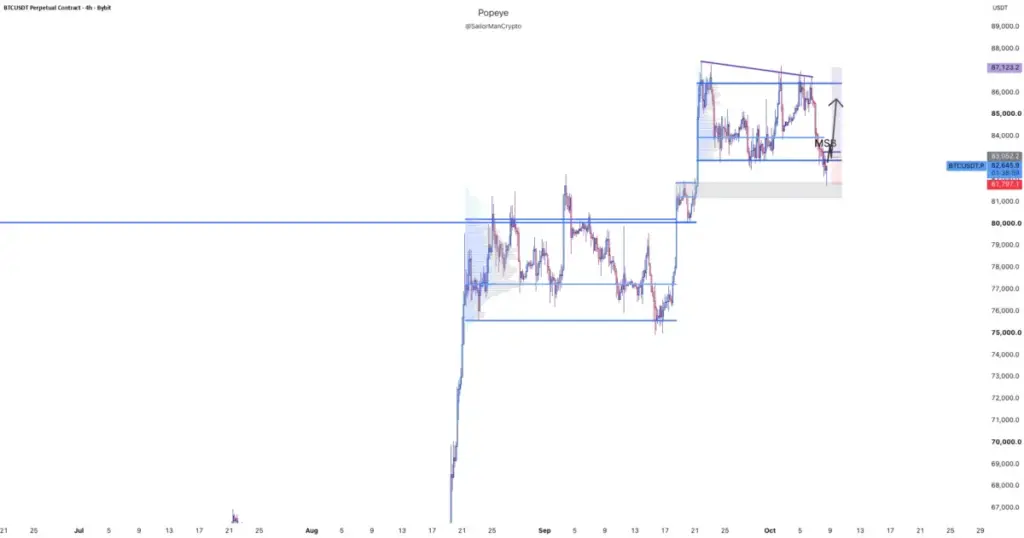
Bitcoin is exhibiting robust signs of a macro trend continuation following a significant structural shift that has caught the attention of market analysts. According to recent technical assessments shared within the cryptocurrency trading community, the world’s leading digital asset has broken out of the consolidation range that has largely contained its price action since February. This pivotal movement is accompanied by a bullish break of structure on the two-day timeframe for the first time in an entire year, signaling a potential transition from prolonged compression to a sustained market expansion.

The breakthrough comes alongside a decisive reclaim of the critical two-day moving average trend, specifically measured by the 200-period exponential and simple moving averages. Technical analysts traditionally view the reclamation of this specific multi-day baseline as a powerful technical development, one that historically opens the door for extended bullish uptrends and renewed institutional interest. Rather than representing a temporary deviation or a false breakout above range boundaries, current price behavior indicates a coordinated market accumulation and subsequent reaccumulation phase stretching from early spring through late summer.
Zooming into the daily timeframe, the overarching market structure remains resolutely bullish. Price action is currently situated well above the crucial bearish market structure break level identified at approximately 74.9 thousand dollars. Technical observers place considerable weight on this daily threshold, noting that any eventual retracement breaking below that specific price point would serve as a severe warning sign for the intermediate outlook. However, as long as Bitcoin maintains its footing comfortably above the value area highs of both the February range and the subsequent August-to-September accumulation range, the prevailing thesis remains firmly aligned with continued upside continuation.
Market participants monitoring intermediate timeframes are also closely watching the four-hour chart, which has proven to be one of the most reliable trend indicators during the current higher-timeframe uptrend. The four-hour trendline has previously provided clean, reliable price bounces upon being tested, and Bitcoin’s current trajectory is once again bringing it into close proximity with this dynamic support zone. Analysts emphasize that before committing capital or blindly trusting this approaching dip, specific market confirmation is required, including the appearance of a recognizable momentum divergence and concrete buying pressure to signal a successful shift in short-term momentum.
Synthesizing these multi-timeframe observations, the primary market thesis suggests that Bitcoin is undergoing a textbook structural expansion following a prolonged period of volatility compression. Because the broader market structure maintains a decisively bullish configuration and historical trading ranges are successfully resolving to the upside, expectations lean heavily toward further price appreciation unless proven otherwise by invalidation triggers.
To capitalize on this technical setup while managing risk effectively, market participants are eyeing a specific confluent zone spanning roughly from 81 thousand down to 78 thousand dollars. This targeted region combines the dynamic support of the four-hour trendline with the key structural resistance-turned-support levels established during the breakout of the previous two trading ranges. Because this targeted zone covers a relatively wide price band, strategic accumulation through multiple scaled bids is considered the optimal approach. Meanwhile, strict risk management dictates that invalidation of the entire bullish thesis rests firmly on a breakdown below the daily market structure threshold.
Should the current market behavior ultimately prove to be a false breakout and the asset falls back inside its historical trading parameters, market participants are prepared to adapt their strategies accordingly. Under such an alternative scenario, traders would wait for a confirmed reclaim of the range accompanied by a lower-timeframe market structure break before engaging in range-bound trading tactics governed by their own distinct target and invalidation boundaries.
 Crypto Investing & Trading
 Crypto Investing & Trading
 Crypto Investing & Trading