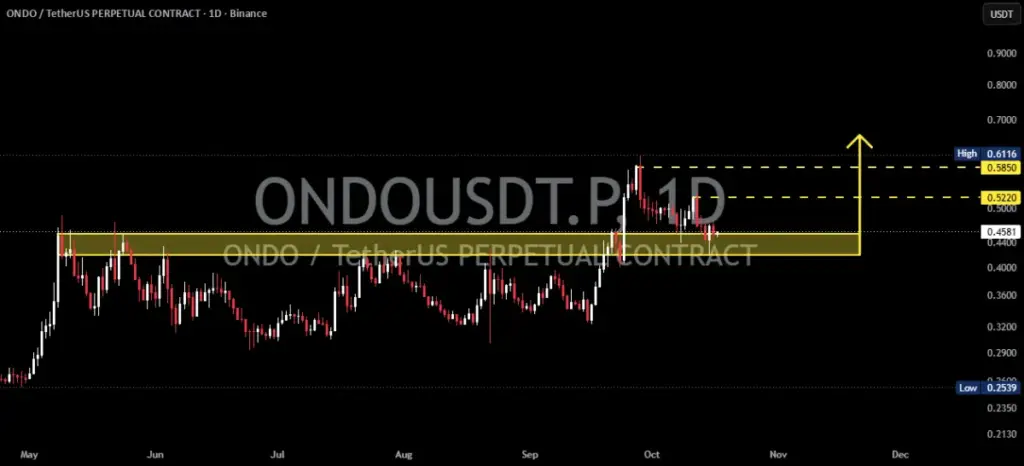
The digital asset market is currently witnessing a pivotal moment for ONDO, which has retraced to retest a major technical support zone ranging between $0.4200 and $0.4572. This closely watched price band previously served as a stubborn ceiling, capping upward momentum until buyers successfully mounted a breakout above it. Following that decisive move, ONDO embarked on a strong bullish rally that carried the token toward the $0.5850 to $0.6116 supply region. However, after touching those upper limits, the asset experienced a natural market pullback, guiding prices back down to evaluate the integrity of the former resistance area.
Market participants and technical analysts are now closely monitoring this retest to determine whether the previous resistance level has successfully flipped into a reliable foundation for future upside. If market buyers manage to defend this zone, the structural shift could reinforce the bullish continuation scenario that began with the initial breakout. Nevertheless, seasoned analysts emphasize that patience is required. Confirmation through localized price action and a definitive daily candle close is widely considered essential before market participants can confidently conclude that the support level is holding firm against selling pressure.
Bullish Scenario and Key Upside Targets
Should ONDO successfully maintain its footing within the $0.4200 to $0.4572 support band and allow buyers to regain firm control of the order books, the digital asset could soon attempt another leg upward toward higher resistance thresholds. In this bullish scenario, market analysts have outlined several key recovery targets that traders will be watching closely as the narrative unfolds.
The initial recovery target on the upside sits at $0.5220, acting as the first major hurdle for a revitalized upward push. A decisive breakout above this $0.5220 level would significantly improve short-term bullish momentum, clearing a smoother path toward the broader $0.5850 region. Beyond that, a sustained move above the $0.5850 major resistance area would bring the previous swing high near $0.6116 back into sharp focus for market participants.
For the bullish continuation thesis to gain validation, specific technical criteria must be met. Traders will look for the price to comfortably hold the highlighted support zone without significant breakdown violations. Additionally, the appearance of bullish rejection candles or a robust price recovery will serve as early indicators of returning buyer demand. Finally, a convincing reclaim of the $0.5220 mark, backed by healthy trading volume, would provide the necessary confirmation that buyers have successfully re-established dominance in the market.
Bearish Scenario and Downside Risks
Conversely, if ONDO proves unable to defend the highlighted support zone and records a decisive daily close beneath its lower boundaries, the integrity of the breakout-and-retest structure would face serious jeopardy. Losing this vital area would signal to the market that current buyer strength is insufficient to maintain the transition of former resistance into active support.
In the event of a breakdown, market participants will be monitoring several key downside regions to gauge the depth of any subsequent correction. The immediate area of interest is the lower boundary of the support zone at $0.4200, followed by the psychological and technical support area situated at $0.4000. Should selling pressure intensify further, ONDO could retreat toward the previous consolidation region spanning from $0.3600 to $0.3500.
Clear indicators of a bearish confirmation would include a definitive daily close below the support band, a failed subsequent attempt by the bulls to reclaim the broken technical area, and an observable increase in selling volume during the breakdown phase. If these conditions materialize, the broader bullish thesis would lose considerable validity, potentially opening the door for ONDO to enter a more prolonged and deeper market correction phase.
Understanding the Breakout and Retest Pattern
The ongoing price action surrounding ONDO offers a textbook illustration of a classic breakout-and-retest pattern, a technical formation frequently observed in financial markets. This pattern unfolds in distinct phases as market sentiment and supply-demand dynamics shift over time.
Prior to the recent upward surge, the price zone between $0.4200 and $0.4572 repeatedly acted as a formidable barrier, with ONDO repeatedly struggling to sustain any meaningful momentum above it. This persistent resistance eventually gave way during a strong momentum shift, allowing the token to break above the zone and rally aggressively toward the $0.5850 and $0.6116 region, highlighting a sharp change in short-term market sentiment.
Currently, the market has entered the retest phase, where the price pulls back to evaluate whether the old ceiling can now function as a floor. The ultimate outcome of this phase will dictate the near-term trajectory of the asset. If buyers step in to defend the territory, the retest validates the bullish market structure. If the zone fails, the initial breakout loses its validity, and prices risk drifting back into their historical trading range. Industry observers frequently remind traders that a retest is not inherently bullish by nature; rather, it is the actual market reaction at the zone that determines whether the structural integrity remains intact.
Key Levels and Market Outlook
As the market digests these recent developments, a clear map of technical thresholds continues to guide sentiment. The primary focus remains anchored on the support zone between $0.4200 and $0.4572, which holds the key to the current market structure. On the upside, the first resistance level is positioned at $0.5220, followed by major resistance at $0.5850 and the previous swing high near $0.6116.
The overarching market outlook for ONDO remains cautiously bullish as long as the critical support zone successfully holds its ground, though market participants universally agree that definitive technical confirmation is still required before establishing long-term directional bias. Analysts and experienced market participants continue to stress that these identified levels represent technical zones observed on charts rather than guaranteed price targets. Factors such as daily candle closes, evolving trading volume, and broader macroeconomic conditions in the cryptocurrency sector remain vital considerations for anyone evaluating the asset, making comprehensive risk management essential during periods of technical retesting.
 Crypto Investing & Trading
 Crypto Investing & Trading
 Crypto Investing & Trading