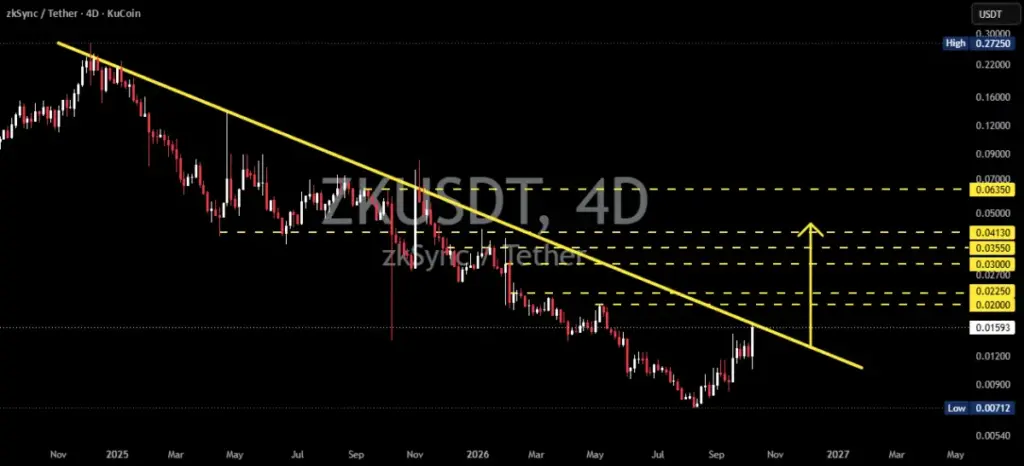
The cryptocurrency market is closely monitoring the price action of ZKUSDT on the 4-day (4D) time frame, where the digital asset is beginning to exhibit signs of a recovery following a prolonged and punishing bearish trend. After plunging to a cyclical low of approximately $0.00712, the token has initiated a notable rebound, gradually working its way upward toward a formidable technical barrier: a long-standing yellow descending trendline.
This descending trendline has served as a dynamic resistance level for an extended period, systematically capping upward price momentum and dictating the broader downtrend that has weighed heavily on the asset from late 2024 through 2026. Currently changing hands around the $0.01594 mark, ZKUSDT finds itself at a critical juncture. Market participants are watching to see whether the asset can decisively overcome this persistent overhead resistance to clear a path toward a more robust recovery phase, or if it will suffer yet another rejection that could drive prices back toward recent lows.
Pattern Analysis and the Significance of the Descending Trendline
To understand the current market dynamics surrounding ZKUSDT, analysts look closely at the architecture of the descending trendline. This classical technical pattern is formed by connecting a sequence of progressively lower price peaks, commonly referred to as lower highs. Such a structure is indicative of persistent, entrenched selling pressure, wherein any bullish attempts to drive the price upward encounter heavy resistance at increasingly diminished levels.
On the ZKUSDT 4D chart, the prominent yellow trendline visually encapsulates the sustained bearish sentiment that has dominated the asset’s trading history over the past couple of years. Despite this gloomy macro backdrop, several recent developments have injected a degree of cautious optimism into the market. The primary catalyst is the successful rebound from the visible chart low of $0.00712, which has sparked renewed buying interest. Recent candlestick formations on the 4-day chart point to a steady upward trajectory as buyers attempt to test the dynamic resistance line once again.
However, market veterans emphasize that a trendline test does not automatically equate to a trend reversal. For a true shift in market momentum to be validated, technical analysts typically look for specific confirmation criteria. Chief among these is a decisive 4D candle close above the descending trendline, ideally accompanied by an expansion in trading volume to demonstrate genuine market participation. Until such a breakout is officially confirmed by price action, the prevailing bearish market structure remains the baseline assumption, leaving open the possibility that the current upward movement is merely a temporary relief rally within a larger downtrend.
Evaluating Key Support and Resistance Levels
Navigating the ZKUSDT market requires a careful mapping of historical technical levels that have defined the asset’s price zones. Below the current trading price, the major line in the sand remains the $0.00712 support level, which established the recent cycle low and serves as the ultimate floor for the current bearish structure. On the other side of the equation, a dense hierarchy of resistance levels looms above the market, marking potential battlegrounds for buyers and sellers should a breakout occur.
In the immediate aftermath of a successful breakout, the first milestones to watch sit in a nearby zone around $0.02000 to $0.02250. Beyond this initial hurdle, the price would encounter psychological and technical resistance at the $0.03000 threshold, followed by an intermediate resistance band stretching from $0.03550 to $0.04130. Further up the chart, a more significant barrier stands at $0.06350, representing a major resistance level and an extended bullish target for the asset. Market observers note that while these figures provide valuable reference points for technical analysis, they are not guaranteed pivot points, and actual market reactions may vary depending on broader macroeconomic and sector-wide conditions.
Analyzing the Bullish Scenario: Breakout and Potential Reversal
The bullish narrative for ZKUSDT hinges entirely on a decisive break above the descending trendline and the subsequent ability of the market to sustain prices above that broken barrier. This constructive scenario unfolds in distinct phases, beginning with the initial breakout. For this stage to carry weight, the asset needs to print a definitive 4D candle close above the trendline, backed by healthy trading volume to ensure that the move is driven by genuine demand rather than low-liquidity noise.
Following a successful initial breach, the ideal technical confirmation involves a retest of the former trendline. If the price can successfully revisit the trendline and establish it as a new foundation of support, the probability of a false breakout diminishes significantly. Should this retest hold firm, market participants would look toward the progression of upside targets, starting with the $0.02000 to $0.02250 range and moving incrementally toward the $0.03000 and $0.03550 to $0.04130 zones.
An eventual push toward the major resistance target at $0.06350 would require sustained buying pressure and the systematic clearing of all intermediate barriers. Accomplishing this would signal a profound shift in market psychology, indicating that persistent selling pressure has finally waned and that buyers have successfully seized control of the medium-term trend.
Analyzing the Bearish Scenario: Resistance Rejection and Trend Continuation
Conversely, the bearish outlook remains entirely viable if ZKUSDT fails to breach the descending trendline or encounters an aggressive wave of selling pressure immediately following a test of the barrier. A strong rejection at this dynamic resistance level would quickly restore control to sellers, potentially triggering a sharp downward correction.
Another risk factor that market participants are monitoring is the threat of a false breakout. If the price momentarily spikes above the trendline but fails to secure a confirmed candle close in that territory, it could trap late-arriving buyers and invite renewed downside momentum. Any significant slip back below the $0.01594 reference price would serve as an early warning sign that the current recovery effort is losing steam.
Should selling pressure intensify, the asset risks tumbling back toward its lower support zones, putting the major cyclical low of $0.00712 back into focus. As long as the market continues to produce a pattern of lower highs and lower lows without a confirmed trendline breakout, the overarching bearish trend retains its structural integrity, counseling caution for market participants.
Technical Outlook and Market Watchpoints
As ZKUSDT presses closer to the decisive descending trendline following its rebound from $0.00712, the immediate future of the asset depends on how price action resolves at this critical juncture. Traders and analysts alike are prioritizing confirmation over anticipation, recognizing that waiting for a verified 4D candle close and volume-backed validation is far safer than attempting to predict a breakout before it happens.
While the potential for a bullish reversal exists—with pathways opening toward $0.02000, $0.03000, and eventually higher targets like $0.06350 upon successful retests—the lingering threat of a trendline rejection and a continuation of the broader bearish structure cannot be ignored. Market participants remain vigilant, tracking volume indicators and candle closes to gauge the true strength of both buyers and sellers in this pivotal phase of price discovery.
 Crypto Investing & Trading
 Crypto Investing & Trading
 Crypto Investing & Trading