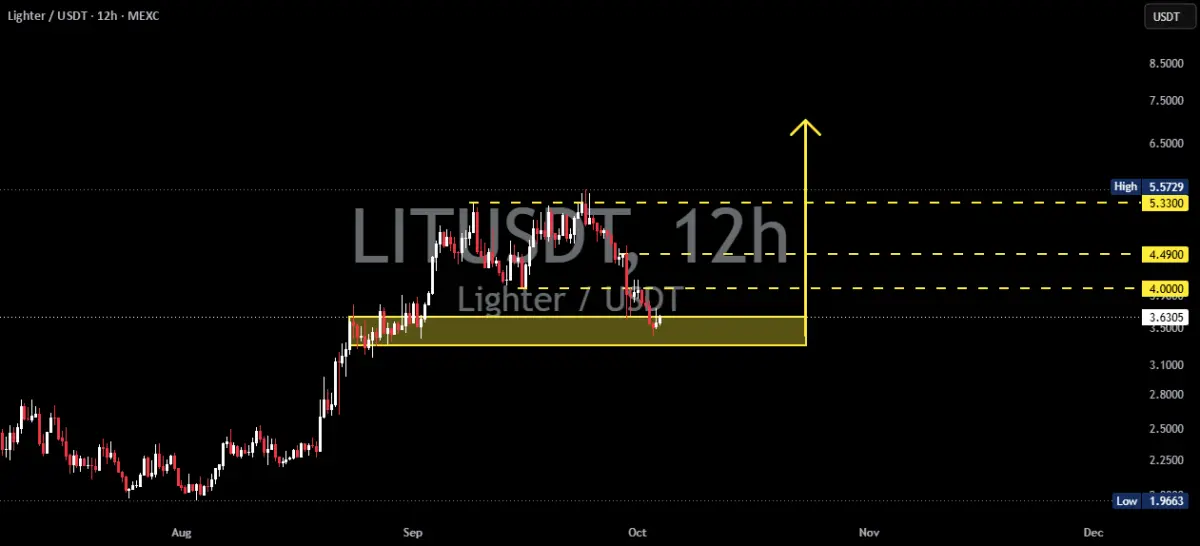
The financial markets are closely monitoring the recent price action surrounding LIT following a powerful bullish impulse that captured the attention of technical analysts and market participants alike. After embarking on a remarkable upward trajectory that saw the asset rally from a floor of approximately $2 to a striking peak of around $5.57, the market structure has shifted into a natural consolidation and correction phase. Rather than continuing an unchecked vertical climb, LIT has retraced its steps downward, bringing the asset back into a historically significant and highly anticipated technical support area.
Market observers tracking the 12-hour time frame note that this pullback is a standard feature of healthy market cycles, offering a potential retest of crucial levels rather than an outright trend reversal. The primary focus for traders and analysts centers on a clearly defined demand zone ranging between $3.30 and $3.63. This highlighted region is widely viewed as a pivotal line in the sand that could dictate the medium-term trajectory of the asset, setting the stage for either a robust continuation of the preceding bullish momentum or a deeper corrective phase should selling pressure intensify.
Chart Analysis and Market Structure
The current chart configuration for LIT presents a classic textbook setup characterized by a strong initial impulse, a period of digestion or consolidation, and a subsequent pullback toward foundational support. During the primary rally, buying volume drove the asset aggressively higher, more than doubling its baseline valuation from the $2 mark up to the $5.57 high-water mark. Such aggressive upward movements almost invariably invite profit-taking from early investors and short-term traders, which naturally precipitates a corrective pullback.
This corrective movement has now successfully guided the price back toward the $3.30 to $3.63 support zone. Technical analysts emphasize that as long as the asset can successfully defend this territory and print clear signs of a bullish rejection—such as lower-wick rejections or decreasing downward momentum—the current retracement serves as a healthy retest before any potential continuation toward higher price levels. Consequently, market participants are viewing this juncture as an intriguing structure for a potential rebound setup, steering away from the risks associated with chasing an asset at the absolute peak of a major rally.
Bullish Scenario and Upside Targets
The probability scales currently lean favorably toward a constructive resolution, with analysts assigning a roughly 70 percent probability to the bullish scenario. This optimistic outlook hinges fundamentally upon the asset’s ability to maintain its footing above the $3.30 to $3.63 support floor. Should buyers re-enter the market with conviction at these levels, creating a dependable price floor and subsequent bullish rejection, several key upside targets come into sharp focus.
The initial hurdle for the bulls lies at the $4.00 psychological and structural resistance level. A decisive reclaim of this threshold with strong momentum would serve as the primary confirmation that the correction has concluded and that the broader uptrend is resuming. Beyond $4.00, subsequent resistance and target milestones are mapped out at $4.49 and $5.33, respectively.
If buying pressure remains exceptionally robust, a push back toward the previous high of $5.57 comes into play. Furthermore, under conditions of sustained and heavy bullish momentum, extended technical projections suggest that the market could eventually target a higher extension zone between $6.50 and $7.00. Achieving these advanced targets would require significant volume expansion and sustained broader market interest, but the foundational chart structure keeps these possibilities open as long as primary support holds firm.
Bearish Risks and Downside Vulnerabilities
While the prevailing technical bias favors a constructive outcome, prudent market analysis necessitates a careful evaluation of potential downside risks. The bearish scenario, assigned a 30 percent probability by technical evaluators, would gain momentum if LIT fails to defend the $3.30 to $3.63 support zone and suffers a decisive breakdown.
A definitive loss of the $3.30 price level would signal a meaningful weakening of the short-term bullish structure that has governed the asset’s recent performance. Analysts caution that a breakdown must be confirmed objectively, specifically looking for a strong 12-hour candle close below the designated support band accompanied by a noticeable increase in trading volume. Such a development would invalidate the immediate continuation thesis and significantly raise the probability of a deeper, more prolonged correction. In the event of such a confirmed breakdown, market participants would need to turn their attention toward historical support levels established prior to the initial rally to gauge where the next major influx of buyers might materialize.
Pattern Description and Technical Outlook
The overarching technical pattern shaping the current narrative for LIT is a classic bullish continuation setup characterized by a pullback retest. The journey from the initial impulse near $2 to the peak at $5.57 created a wide trading range, and the subsequent retracement has compressed the price action back into the vital $3.30 to $3.63 demand zone. This region represents the frontline where market bulls are expected to make their stand to protect their positions and establish a foundation for the next leg upward.
Despite the optimistic probabilities assigned to the chart structure, professional analysts reiterate that the bullish thesis lacks absolute confirmation while the price remains capped below the immediate overhead resistance at $4.00. Breakout confirmation remains an essential prerequisite for establishing high-conviction positions, as premature entries before a confirmed defense of support or a break above resistance carry heightened exposure to market volatility.
Ultimately, LIT finds itself at a critical technical crossroads following its extensive rally. The coming sessions on the 12-hour time frame will be vital in determining whether the current price area acts as a springboard for a renewed advance toward $4.00, $4.49, $5.33, and beyond, or whether crumbling support will trigger a deeper retracement toward historical price floors. Market participants continue to monitor volume patterns and candle closes closely for the definitive signals that will shape the asset’s next major directional move.
 Crypto Investing & Trading
 Crypto Investing & Trading
 Crypto Investing & Trading