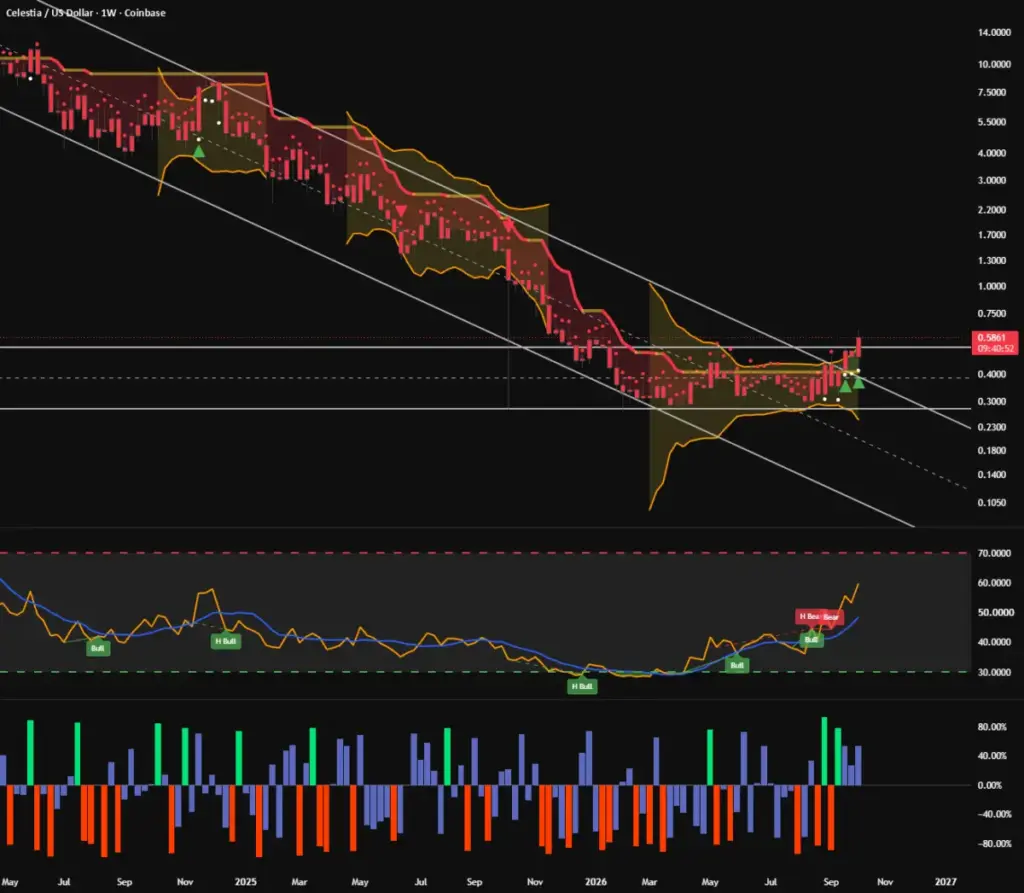
The native token of the Celestia network, TIA, is currently hovering around the $0.576 mark as it faces a critical technical juncture. Rather than signaling an immediate breakout, market analysts note that current price action represents a test of the underside of a multi-year descending channel that has dictated the asset’s trajectory since its highs in 2024. The development highlights a pivotal moment for the token as it attempts to transition from a prolonged bearish markdown phase into a constructive accumulation base.
Where We Are in the Cycle
To understand the current technical posture of TIA, market participants are looking closely at the broader macro cycle that has played out over the past year. The primary markdown phase was severe, carrying the token down from a major peak near $21 in February 2024 all the way into a heavy selling climax zone between $0.28 and $0.30 earlier this year.
In the wake of that capitulation, the asset has exhibited classic post-climax behavior. This has manifested as a long, grinding trading range. While lower highs have remained a consistent feature of the chart, the selling pressure has notably decelerated, and the downside momentum has stopped producing meaningful new lows. For months, the price has successfully defended the $0.28 to $0.30 floor, even as the broader descending structural boundaries remained intact overhead.
The recent push driving TIA toward the $0.57 to $0.60 range marks the first genuine attempt by the market to challenge the upper boundary of that multi-month structure. Notably, volume metrics have expanded during this upward movement, and momentum oscillator panels have begun printing multiple bullish tags after spending an extended duration in suppressed territory. Technical observers point out that this behavior aligns closely with an accumulation phase attempting to break out and transition into a markup phase, though definitive confirmation is still missing.
What the Chart Is Actually Doing
A closer inspection of the price action reveals that the technical bands governing the asset’s volatility have grown increasingly tight. This kind of price compression is historically typical of the later stages of a structural base-building process. TIA is presently pressing against the upper edge of this established range, while longer-term descending trendlines continue to loom overhead. Price reactions visible along the structure indicate ongoing battles between buyers and sellers rather than a clean, definitive change in market character.

Market participants are closely monitoring several key price levels that dictate the short- and medium-term outlook. The interplay between these boundaries will likely determine whether the current upward pressure resolves into a sustained trend reversal or simply fades back into the broader consolidation range.
Scenarios
Looking ahead, analysts have outlined two primary paths for TIA based on how it interacts with current resistance levels.
If this current movement proves to be the beginning of an early markup phase, the market must see a decisive acceptance of price above the multi-year descending structure, backed by sustained follow-through. Specifically, a confirmed weekly close above the $0.60 threshold, accompanied by healthy volume, would open the door for potential upside targets in the $0.70 to $0.90 range. Such a move would go a long way toward invalidating the multi-year channel that has capped the asset’s performance. Until that specific structural shift occurs, however, the larger macro narrative remains one of markdown-to-accumulation rather than confirmed markup.
Conversely, if the current push higher runs out of momentum and fails, the wider trading range spanning roughly $0.38 to $0.60 will likely remain the working environment. Such a failure would be entirely normal for an incomplete base. Should the asset suffer a weekly close below the $0.50 to $0.52 support area, it would significantly increase the probability of a downward retest of the $0.38 level. A subsequent break of that $0.38 floor would ultimately put the critical $0.28 to $0.30 zone back on the table.
Bottom Line
Ultimately, TIA has succeeded in halting its sequence of lower lows and is now actively testing the upper boundary of its long-term descending structure. This test is supported by expanding trading volume and recovering upward momentum, fitting the profile of an accumulation attempt following a deep and prolonged markdown. However, it does not yet display the definitive change of character required to confirm a true markup phase. The $0.60 level remains the definitive threshold that needs to be accepted through sustained closes rather than merely touched by transient wicks. Until that milestone is achieved, the asset remains range-bound within a larger, ongoing downtrend structure.
 Crypto Investing & Trading
 Crypto Investing & Trading
 Crypto Investing & Trading