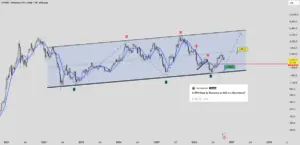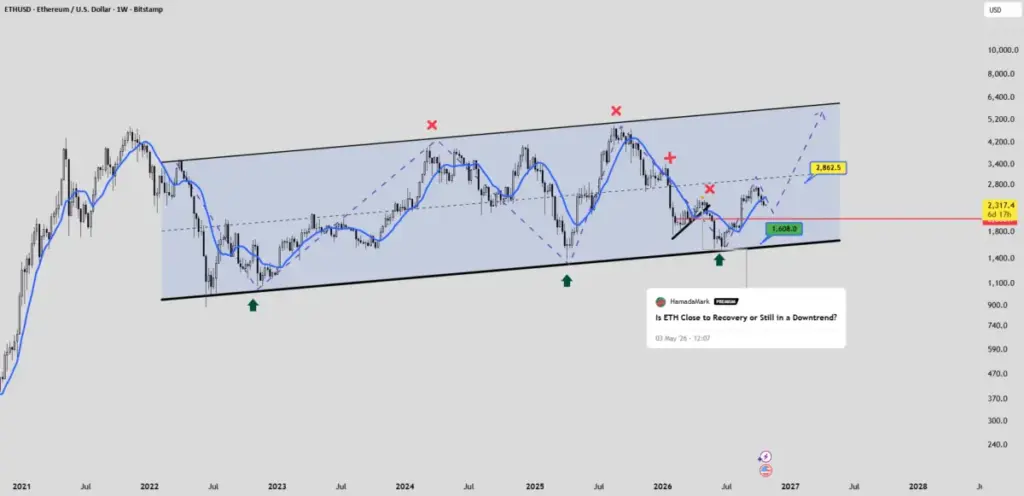
The cryptocurrency market continues to experience heightened volatility as Ethereum (ETH) tests critical structural boundaries following a powerful upward rally. After staging an impressive surge that saw prices climb by nearly 85 percent—moving from a swing low of $1,500 up to a local peak of $2,800—the leading altcoin has officially lost its upward momentum. This deceleration occurred precisely as ETH approached the vital midline of its prevailing macro channel, prompting a steady retracement that has brought the asset back down toward the $2,300 region.
Market participants who followed the previous comprehensive ETH market analysis shared back in May have witnessed the asset play out its cycle through these anticipated fluctuations. Since hitting that $2,800 threshold, Ethereum has slowly drifted downward, shedding gains and inching closer to another pivotal technical juncture. The central question currently facing traders, investors, and analysts alike is whether this current movement represents a healthy mid-trend correction before the next major leg up, or the precursor to a deeper market-wide pullback.
To understand what lies ahead for the ETH/USDT trading pair, market observers are closely examining the broader chart structure, identifying key support boundaries, and evaluating potential reversal zones. Technical analysis of the current market architecture indicates that the primary support area and Potential Reversal Zone (PRZ) is firmly established between $2,100 and $1,900. This multi-hundred-dollar band represents a crucial historical inflection point that could dictate Ethereum’s price trajectory for the remainder of the cycle.
The behavior of market buyers within this $2,100 to $1,900 window will be decisive. If the bullish camp manages to step in, absorb the selling pressure, and successfully defend this zone with convincing, high-volume price action, the medium-to-long-term outlook remains distinctly optimistic. Under a successful defense scenario, technical projections outline a potential recovery path that could first target a robust climb toward the $5,500 milestone. Beyond that initial recovery phase, a successful continuation of the broader bullish market structure could eventually pave the way for a long-term macro extension reaching as high as $7,250.
At the same time, market veterans emphasize that these ambitious upside targets are entirely conditional. Achieving such valuations requires Ethereum to definitively regain its lost momentum, validate the integrity of the bullish structure, and sustain buying pressure across broader market cycles. In the volatile environment of digital asset trading, nothing is ever guaranteed, and market dynamics can shift rapidly in response to macroeconomic data, regulatory updates, and sudden shifts in liquidity.

From a tactical perspective, experienced market analysts advise caution rather than impulsive action. For those looking to accumulate Ethereum or expand existing positions, waiting for the asset to test the deeper $2,100 to $1,900 support region is viewed as a far more prudent strategy than chasing green candles at current intermediate levels. However, reaching a designated support zone does not automatically translate into an immediate or guaranteed price reversal. Markets have a history of breaking through anticipated support levels when broader sentiment turns bearish or unexpected macro shocks occur.
Recent history serves as a stark reminder of these market realities. The market conditions and unexpected price movements witnessed in October 2025 provided traders with a valuable lesson regarding sudden, counter-trend volatility and unpredictable corrections. Ignoring those historical lessons or assuming that support levels are impenetrable fortresses can lead to unnecessary risk exposure. Prudent capital management dictates that traders prepare for adverse scenarios rather than relying solely on best-case projections.
A comprehensive view of the current technical landscape highlights the specific parameters defining the trade setup. The primary buy zone and Potential Reversal Zone is strictly defined between $2,100 and $1,900. On the upside, the defined recovery targets remain anchored at $5,500 for the intermediate phase, with a secondary long-term extension target resting at $7,250. Navigating these levels requires adherence to time-tested trading principles, famously encapsulated by the market adage that a good captain prepares for the storm before raising his sails.
As Ethereum hovers near these critical junctures, market participants continue to monitor order books, volume profiles, and broader crypto market correlations to gauge the next definitive directional move. Whether the asset finds a durable bottom in the low $2,000s or extends its correction before staging a genuine recovery remains one of the most closely watched narratives in the digital asset space.
 Crypto Investing & Trading
 Crypto Investing & Trading
 Crypto Investing & Trading