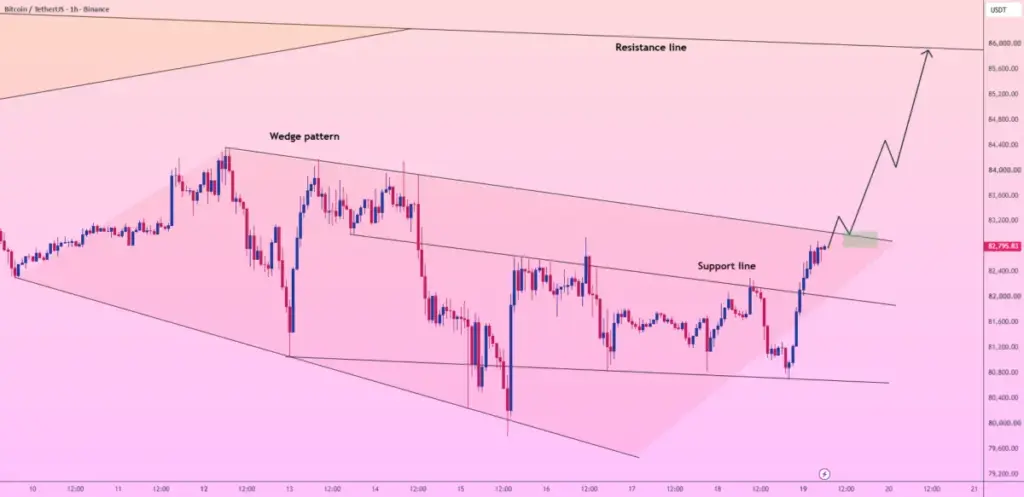
Bitcoin is once again showing notable signs of technical life across the charts, having successfully cleared a descending wedge pattern on the one-hour timeframe. By managing to reclaim the upper trendline of this widely monitored consolidation structure, the leading cryptocurrency is shifting gears from a protracted period of range-bound consolidation into what many market participants hope will be a decisive breakout phase. The transition marks an important shift in short-term market dynamics, capturing the attention of technical traders and macro analysts alike as price action attempts to establish a firmer footing following weeks of choppy trading.
At the heart of the current technical setup is a critical retest of the former resistance level, which has now inverted into a potential zone of support. How price behaves around this immediate juncture is widely considered paramount for the continuation of the current bullish momentum. If the support level manages to hold firm against selling pressure, market expectations point toward a momentum-driven extension that could pave the way for a test of the $86,000 ceiling. Conversely, any failure to maintain this vital price floor could quickly invalidate the technical setup, signaling a potentially false breakout that risks dragging the asset right back down into the familiar confines of the descending wedge structure.

This technical development is not unfolding in a vacuum, finding crucial backing from broader financial markets. Bitcoin is rallying alongside upbeat Nasdaq futures during today’s trading sessions, buoyed heavily by incoming macroeconomic data from overseas. Most notably, fresh economic indicators out of China revealed that the country’s Gross Domestic Product beat analyst expectations, offering a much-needed injection of optimism into global risk assets. These favorable macroeconomic tailwinds are providing the vital fundamental conviction required to support and validate what might otherwise be viewed as a purely speculative technical breakout on lower timeframes.
The convergence of supportive macro data and a clean technical chart pattern has brought key price boundaries into sharp focus for market participants monitoring the hourly charts. Immediate resistance is currently pegged firmly at the $86,000 mark, representing the primary upside target should current buying momentum persist through the rest of the trading day. On the downside, critical support is situated near $82,600, acting as the final line of defense for bulls looking to validate the breakout and prevent a slide back into the previous consolidation channel. As traders weigh these critical levels against the backdrop of shifting global economic sentiment, the coming hours will likely dictate whether Bitcoin can sustain its upward trajectory or succumb to another round of choppy consolidation.
 Crypto Investing & Trading
 Crypto Investing & Trading
 Crypto Investing & Trading