Bitcoin (BTC) continues to navigate a critical juncture in its market trajectory as it trades near $77,559 on November 1, 2026. While the macro perspective maintains a fundamentally robust long-term bullish structure, immediate price action reveals growing short-term friction between buyers and sellers. Traders and market participants are closely monitoring a series of tightly contested technical boundaries that could dictate the next major directional move for the leading cryptocurrency as it interacts with established chart patterns.
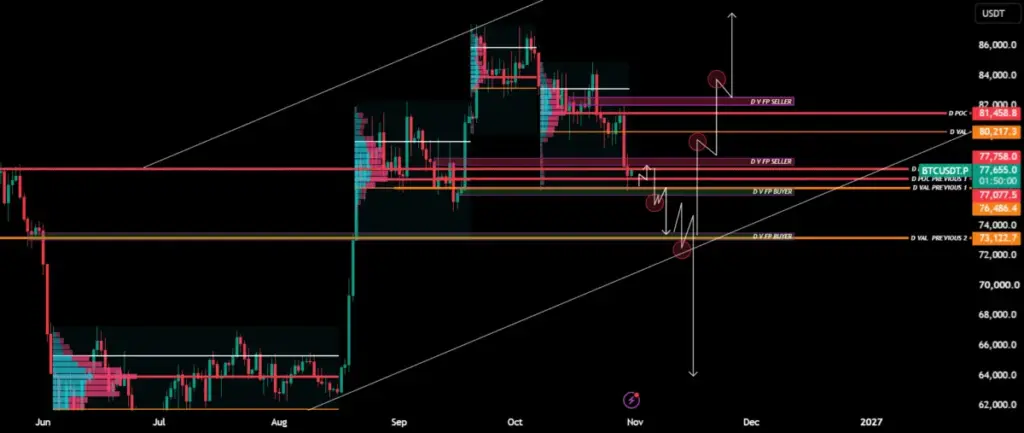
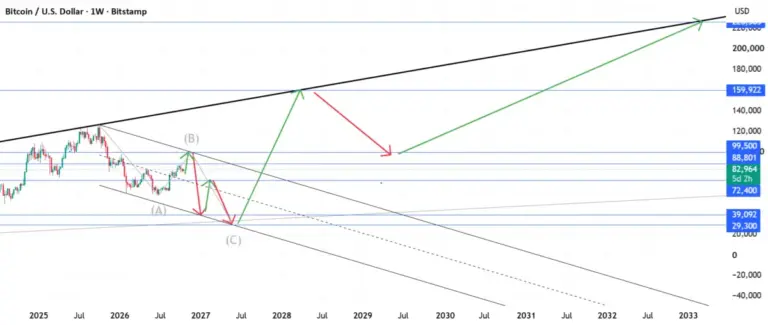
The broader market outlook highlights that Bitcoin remains comfortably embedded within a larger ascending channel formation. This macro structure has historically supported sustained upward momentum over extended periods, reflecting underlying demand and broader adoption trends. However, the intensity of the current market cycle has brought short-term participants to the forefront, where selling pressure has visibly intensified. This divergence between an overarching bullish macro framework and a cautious short-term sentiment has created a delicate balancing act on the daily charts, focusing attention on immediate supply and demand zones.
Seller Control and Resistance Dynamics
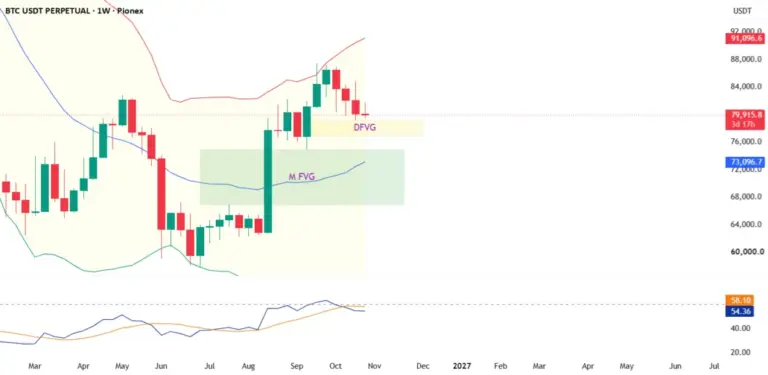
On the daily timeframe, sellers have actively established dominance underneath a formidable overhead supply region. Price action demonstrates that bears are maintaining firm control below the $77,758 to $80,427 resistance zone. This specific technical band has acted as a persistent ceiling, repelling recent advance attempts by bullish market participants and keeping upward mobility restricted.
Whenever Bitcoin has attempted to challenge or breach the lower bounds of this resistance cluster, selling volume has stepped in to suppress the momentum. This dynamic underscores the significance of the $77,758 threshold as an immediate breakout target. For the market to alleviate current short-term bearish pressures, buyers must decisively reclaim this barrier, which would open a path for potential appreciation toward the upper resistance parameters spanning from $80,427 to $81,458. Until a convincing daily close is established above these resistance levels, the burden of proof remains firmly on the buyers to demonstrate sufficient market depth and momentum to alter the current near-term trajectory.
Buyer Defense and Support Zones
Conversely, market demand is currently congregating around a vital defensive perimeter. Buyers have actively stepped in to safeguard the $77,077 to $76,486 support zone, absorbing incoming sell orders and attempting to establish a local floor. The defense of this area is critical for maintaining the integrity of the immediate price structure, as any failure by the bulls to hold this line could accelerate downward momentum.
The interaction between buyers and sellers within this narrow band highlights the current indecision in the marketplace. As long as the $77,077 to $76,486 range holds firm, the market retains a chance to consolidate and build a base for another challenge toward upper resistance. Nevertheless, the proximity of the current trading price to this lower boundary leaves little room for error on the part of market bulls.

Bearish and Bullish Scenario Outlines
Market analysts evaluating the current technical landscape have mapped out two primary scenarios based on impending price action developments relative to these established boundaries. In the bearish scenario, heightened attention is directed toward a confirmed daily close below the critical $76,486 support threshold. Should sellers breach this floor, Bitcoin could experience an extended decline, pulling prices down toward the $73,145 region. This lower target represents a significant support area situated within the broader ascending channel, and a sustained test of this level would re-evaluate the strength of the macro trend structure.
On the other hand, the bullish scenario hinges on the ability of buyers to successfully reclaim the $77,758 resistance level. Achieving a confirmed break and hold above this price point would invalidate the immediate short-term bearish control and signal a shift in market sentiment. Under such conditions, price appreciation could target the broader $80,427 to $81,458 zone, aligning the short-term performance with the broader, long-term bullish channel framework.
Market Outlook and Strategic Approach
The overarching narrative for BTCUSDT remains anchored to its position within the larger ascending channel, reminding market participants of the prevailing long-term structure despite the current headwinds. However, the escalation of short-term selling pressure necessitates heightened vigilance, particularly regarding the $73,145 support zone as a worst-case downside marker should the immediate defenses fail. A confirmed breakdown below this area would fundamentally alter the near-term technical outlook and open the door to deeper corrective phases within the channel.
In light of these conflicting technical pressures, prevailing trading strategies advocate for patience and discipline. Market observers emphasize the importance of waiting for clear price action signals and volume footprint confirmation before committing capital to either buy or sell positions. Rushing into trades without these vital confirmations exposes participants to unnecessary market noise, reinforcing the guiding market principle to avoid the psychological traps of fear of missing out, commonly known as FOMO.
As the daily chart continues to evolve, the interaction between the current support and resistance boundaries will provide the definitive clues needed to determine whether Bitcoin can resume its macro ascent or whether a deeper correction toward the lower bounds of the ascending channel is imminent. All analysis remains derived strictly from current chart configurations, and market participants are reminded that financial trading inherently carries risk.
 Crypto Investing & Trading
 Crypto Investing & Trading
 Crypto Investing & Trading