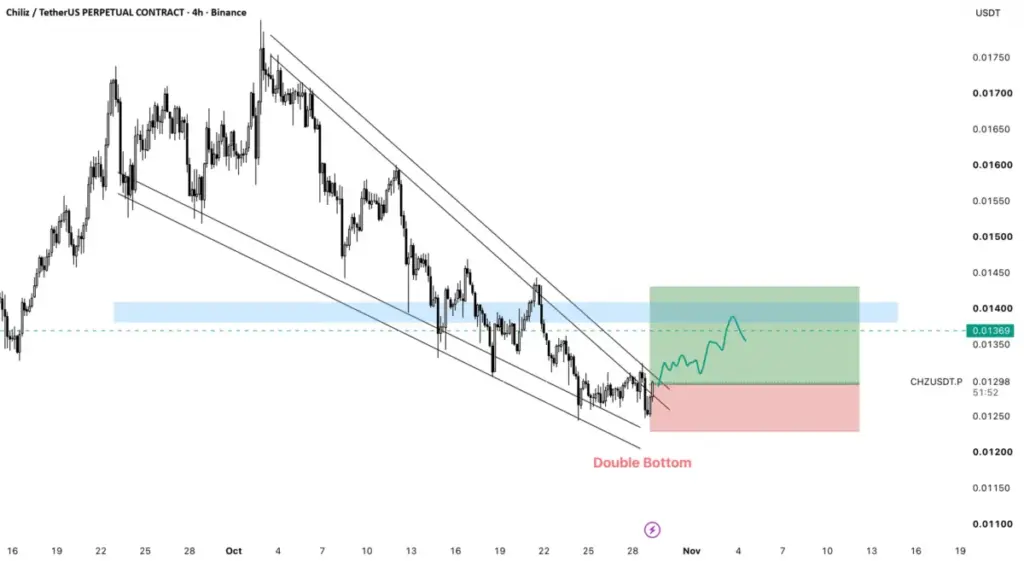
Chiliz (CHZ) has been trapped in a persistent and well-defined downtrend for weeks, steadily grinding lower within a classic descending channel. However, market participants tracking the 4-hour timeframe are now focusing on a potentially significant technical development unfolding at the lower boundary of that channel. A classic double bottom formation is currently taking shape right at the crucial support zone, raising questions about whether the token is finally preparing to halt its downward trajectory and initiate a corrective bounce or a broader trend reversal.
For weeks, price action for CHZ has been characterized by lower highs and lower lows, perfectly respecting the parallel boundaries of a descending channel. This structural decline reflects sustained selling pressure and a broader lack of aggressive bullish momentum across the short-term horizon. Yet, technical analysts monitoring the asset have noted a shift in behavior near the lower boundary. The appearance of a double bottom pattern—traditionally viewed as a reversal signal—suggests that selling exhaustion may be setting in as the token tests vital structural supports.
A closer examination of the current 4-hour chart reveals several key technical observations that define the setup. Most notably, the formation features two distinct bottoms with remarkably similar relative lows, indicating strong buyer defense at these specific price levels. Furthermore, the price of CHZ is currently testing the neckline area hovering around the 0.0137 mark. While the descending resistance line that has guided the broader downtrend remains overhead, technical indicators suggest that this resistance line is starting to lose its aggressive angle, a common precursor to a potential breakout or trend exhaustion.

This confluence of technical factors—combining a classic double bottom pattern directly with established channel support—frequently signals a turning point for digital assets caught in extended corrections. Market technicians often look for such setups to gauge whether a downtrend has run its course, paving the way for a corrective relief bounce or, in more robust scenarios, a full structural trend reversal.
For traders and market participants monitoring short-term setups with a long bias, the current price action offers a defined framework for risk management and potential entry. The active entry zone is currently identified between the present levels and the 0.0136 to 0.0139 range. To manage downside exposure, an invalidation or stop-loss level is typically placed just below the recent double bottom lows, an area highlighted as the red zone on the chart to protect capital against a breakdown of the support structure.
On the upside, the initial price target focuses on horizontal resistance and previous market structure around the 0.0143 to 0.0145 range. If broader market momentum continues to build and buyers manage to force a decisive break of the descending trendline, extended targets point toward the higher channel resistance boundaries, mapping out a projected path illustrated by the green trajectory on the chart. Because this configuration is observed on a 4-hour timeframe, market participants note that the pattern will likely take time to fully develop, unfolding over the course of the next few days to a couple of weeks depending on prevailing trading volume and overall cryptocurrency market conditions.
As with any technical analysis in the digital asset space, these observations reflect a specific chart structure rather than guaranteed market outcomes. Market watchers continue to debate the broader implications of the current price action, weighing whether the emerging double bottom will successfully catalyze a bullish reversal or if persistent market headwinds leave room for further downside before a sustainable bottom is established.
 Crypto Investing & Trading
 Crypto Investing & Trading
 Crypto Investing & Trading