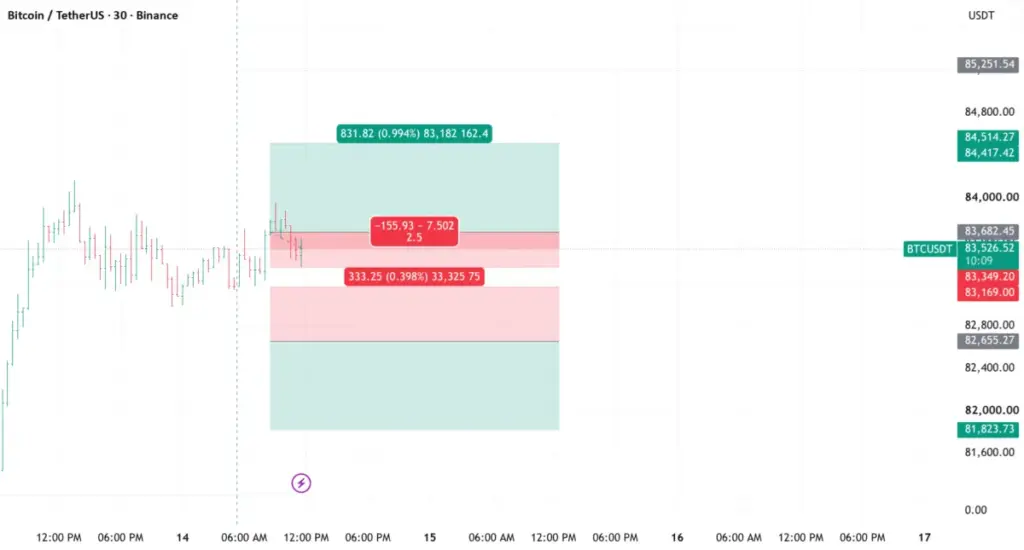
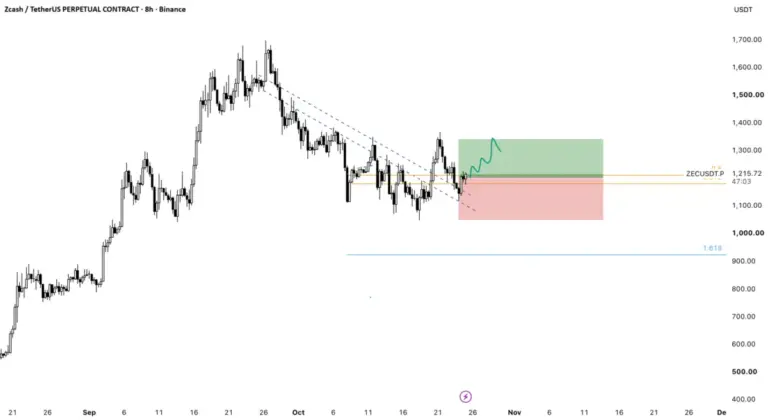
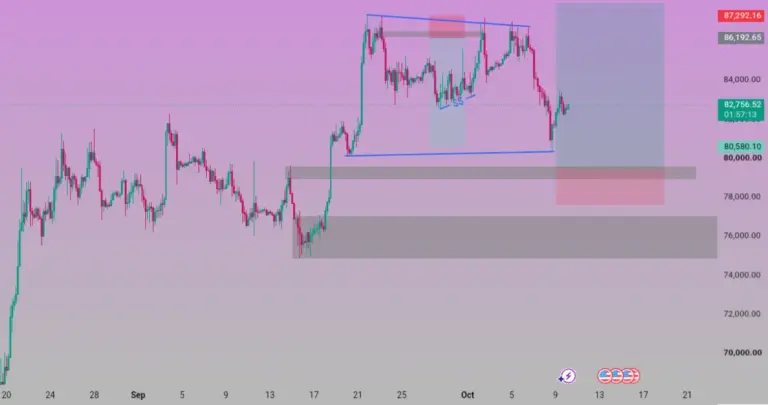
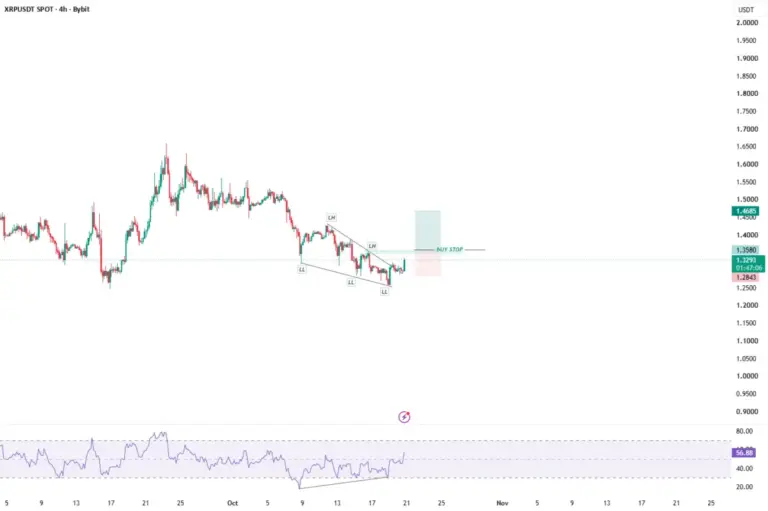
Financial markets are currently seeing heightened focus on systematic breakout strategies as traders navigate tightening ranges and key technical boundaries across major asset classes. Recent data outlines specific trade setups, including active buy and sell parameters, alongside the core mechanical principles that govern how momentum accelerates when prices violently exit defined consolidation zones.
A breakout strategy remains a classic trading approach designed to capture market moves just as an asset breaches a defined range, consolidation pattern, or key technical boundary. The core thesis behind this market behavior is relatively straightforward: when prices successfully push through a critical level of support or resistance, market momentum accelerates rapidly. This acceleration typically occurs as trapped market participants are forced to cover their losing positions while fresh liquidity and new participants jump into the fray, jointly pushing prices swiftly in the direction of the initial break.
The mechanics of this phenomenon begin with market compression and consolidation. During these phases, price action moves sideways within a defined range, a symmetrical triangle, a parallel channel, or a rectangle. Market energy builds during these periods much like a compressed spring waiting for release. This phase is followed by a catalyst or expansion event, where trading volume surges as the price closes decisively outside the boundary level. The final phase involves either immediate continuation or a retest, where prices either trend aggressively in the breakout direction or briefly pull back to test the former resistance or support level before resuming their primary trajectory.
Market observers note that high-probability setups require a confluence of specific technical components. The identification of key levels is paramount, relying on clearly defined horizontal boundaries such as swing highs and lows, equal highs and lows, or dynamic levels including moving averages, trendlines, and daily open ranges. Furthermore, authentic breakouts necessitate heavy trading volume. Low-volume breaks frequently result in false breakouts, or fakeouts, which are essentially liquidity sweeps that quickly reverse direction and catch aggressive traders off guard. Volatility contraction is another vital precursor, with the most reliable breakouts typically occurring after prolonged periods of low volatility, such as tight consolidations or Bollinger Band squeezes. Finally, market participants emphasize the importance of a decisive candle close rather than relying on wick breaks, waiting for timeframes ranging from fifteen minutes to four hours to close firmly outside the barrier.
Different variations of these strategies cater to varying market conditions and asset types. Horizontal range breakouts occur when prices bounce multiple times between flat support and resistance levels, triggering trades upon a candle close beyond those borders, making them particularly popular among range-bound foreign exchange pairs, gold, and equities. Chart pattern breakouts focus on formations like flags, pennants, triangles, and head-and-shoulders necklines, relying on trendline breaches accompanied by volume in trending markets and momentum assets. Opening range breakouts focus on the price boundaries established during the first fifteen to thirty minutes of a trading session, capturing volatility during active market opens such as US equity indices and precious metals. Meanwhile, the break-and-retest approach appeals to more conservative market participants who prefer to wait for prices to pull back and test the broken boundary before entering upon receiving a confirmed price rejection signal.
Execution and risk management rules dictate how these setups translate into active market positions. Aggressive market participants often utilize market orders immediately upon a candle close past a key level, whereas conservative traders prefer waiting for a pullback to confirm the new role of the former boundary. Risk management mandates strict stop-loss placement, typically positioned back inside the consolidation range just below the breakout candle’s low for a buy order, or above the corresponding high for a sell order. Take-profit targets are similarly calculated by aiming for the next major liquidity level or by measuring the total vertical height of the consolidation pattern and projecting that exact distance outward from the breakout point.
Despite the structural appeal of these strategies, the primary risk facing market participants remains the false breakout or fakeout. A fakeout transpires when an asset’s price briefly pierces a technical level, grabs available liquidity by triggering stop-loss orders, and instantly reverses back into the established trading range. To effectively filter out these deceptive moves, traders rely on several criteria, including requiring high volume on the breakout candle, aligning trades with the prevailing higher-timeframe trend bias, ensuring multi-timeframe confirmation, and utilizing momentum indicators such as the Average Directional Index to verify underlying trend strength.
Market veterans often point to ten essential tenets required to master breakout trading. First, market compression invariably precedes expansion, meaning that the longer an asset builds energy within a tight range, the more explosive the resulting breakout tends to be. Second, a decisive candle close must always take precedence over fleeting wicks, as wicks often represent temporary liquidity grabs rather than genuine trend continuations. Third, volume confirmation remains an absolute requirement, given that institutional participation is necessary to sustain true momentum, making low-volume breaks highly suspect.
Fourth, traders must focus exclusively on clear, high-consequence technical levels that contain obvious liquidity pools, such as major swing highs and weekly boundaries. Fifth, constant vigilance against fakeouts is required, reinforcing the necessity of volume filters and candle close confirmations. Sixth, the power of the break-and-retest methodology offers a higher safety margin for risk-averse participants who prefer confirmation over chasing raw momentum. Seventh, aligning lower-timeframe trades with the dominant higher-timeframe directional bias significantly improves overall statistical probability. Eighth, strict stop-loss placement remains non-negotiable to protect capital against sudden market reversals. Ninth, objective profit targets derived from historical support, resistance, or measured moves remove emotional decision-making from the exit process. Tenth, session timing and volatility play an irreplaceable role, with the most robust breakouts occurring during peak session overlaps and major economic news releases rather than during slow, low-volume market lulls.
 Crypto Investing & Trading
 Crypto Investing & Trading
 Crypto Investing & Trading