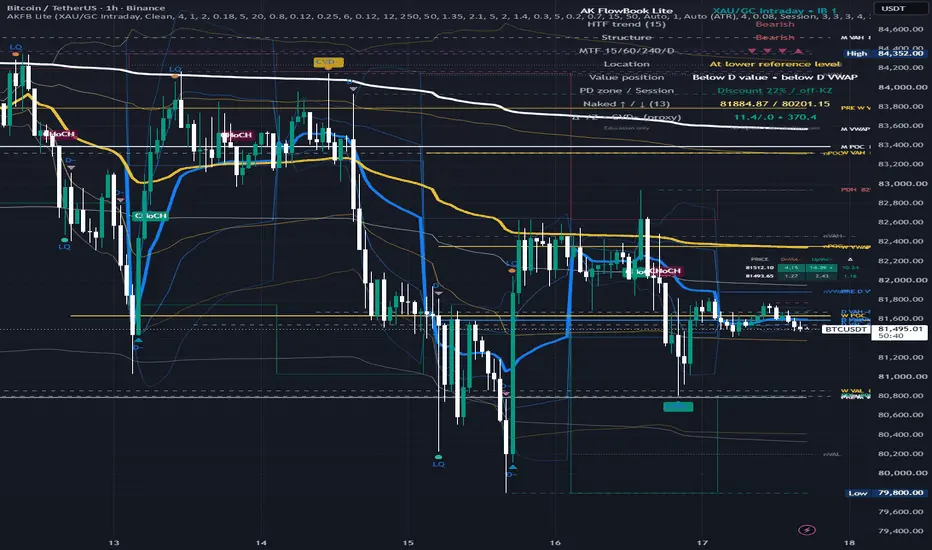
In the complex and fast-moving world of cryptocurrency derivatives trading, market participants are constantly searching for structural reference points that can offer insight into institutional behavior and liquidity distribution. Among the various tools utilized by volume-based traders, the Point of Control, commonly referred to as the POC, stands out as one of the most critical metrics for assessing where market consensus lies during a specific trading session.
The POC represents the exact price level within a given session where the highest volume of contracts or assets was traded. It signifies the primary area of fair value where buyers and participants engaged in the heaviest transactional activity. However, market dynamics often cause price to rapidly depart from these areas of heavy accumulation, leaving behind a footprint that volume traders monitor closely. When a session concludes and price moves away from its POC without revisiting that specific price level during the remainder of that session, the level is categorized as a "naked" or untouched POC. It remains in this unfulfilled state until a subsequent price bar or trading session trades back through it, thereby touching or "filling" the level.
Understanding why market participants track these naked POCs requires a deeper look into auction market theory and liquidity dynamics. The POC represents the price level where both sides of the market—buyers and sellers—agreed most strongly on valuation during that specific time frame. When the broader market leaves this zone quickly and fails to return immediately, that historical agreement remains unverified and retested. Many volume-focused traders deliberately keep these untouched levels marked directly on their price charts to serve as structural reference points, operating under the observation that price action frequently gravitates back toward these historical magnets to test whether that previous agreement still holds validity under current market conditions.
The methodology for identifying and tracking these levels requires precise data collection and consistent parameters. Analysts typically construct daily volume profiles using granular data feeds, such as 1-minute interval data mapped across coordinated universal time days, segmented into standardized price bins, such as fifty-dollar increments. By isolating the POC of each finished day, traders can establish a chronological ledger of untouched historical value areas. Every subsequent price bar is then evaluated against these historical markers, checking whether the high-and-low range of a developing bar overlaps with the designated POC to determine if the level has been successfully mitigated or filled.
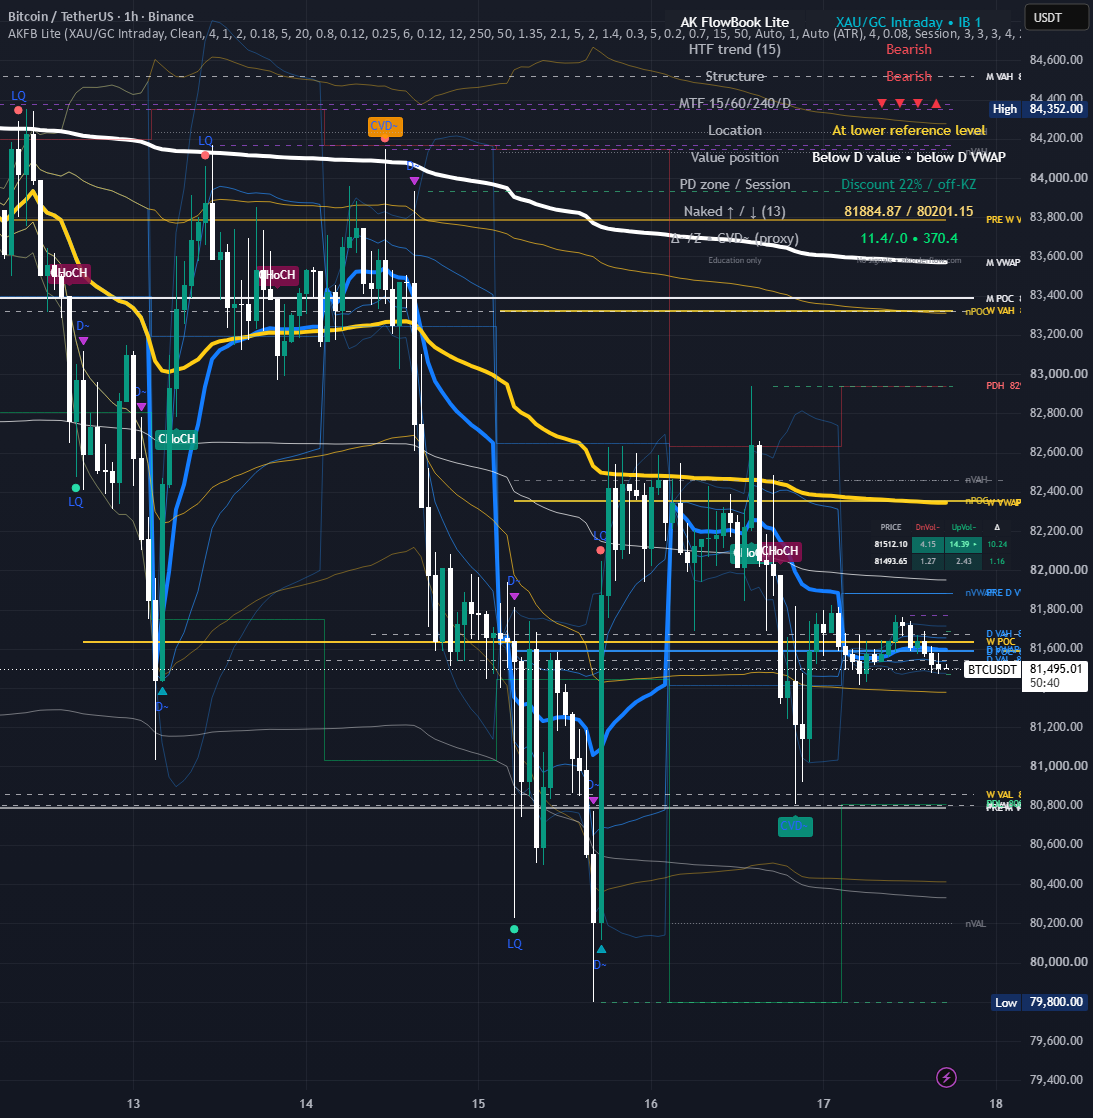
Recent market data captured across a twenty-day observation window running from late September through mid-October highlights the operational behavior of these daily volume markers. Out of twenty consecutive daily POCs analyzed during this timeframe, fourteen were revisited and touched by price action during the very next trading session, demonstrating a high frequency of near-term mean reversion and liquidity testing. An additional five naked POCs were touched within a window spanning two to six days after their initial formation. As an illustrative example of this behavior, the daily POC established on October first at a price level of 83,475 remained untouched and naked for six consecutive days before finally being filled and mitigated during the trading session on October seventh. Meanwhile, isolated instances demonstrate that certain levels can persist for extended periods, such as the daily POC recorded on October fourteenth at 83,425, which remained open as traders assessed ongoing market structures.
Current chart configurations reveal persistent naked POCs that continue to draw the attention of volume market participants. Specifically, the price level of 83,425 stands out as a significant zone because both October thirteenth and October fourteenth recorded their respective session POCs at this exact price. While the POC originating from October thirteenth was eventually filled during the early stages of the October fourteenth trading session, the subsequent POC established by October fourteenth itself has remained untouched since its formation, creating a notable double POC structure that lingers on the charts. Additionally, the daily POC established on October sixteenth at 82,175 remains open as broader market ranges continue to fluctuate below these historical reference points, with spot prices hovering near the 81,500 threshold and residing beneath both of these established value nodes.
Utilizing these volume metrics effectively requires an understanding of their limitations and appropriate application contexts, as market technicians emphasize that naked POCs should be treated strictly as structural reference points rather than deterministic trading targets. While empirical observation indicates that a significant majority of naked POCs eventually get filled by subsequent price action, the exact timing of these retests remains entirely unknown, with certain levels lingering open for weeks or even months depending on broader macro trends and directional momentum shifts.
These historical zones carry the greatest analytical weight when they align harmoniously with other established volume distribution levels, such as weekly value area boundaries, high-volume nodes, or volume-weighted average price indicators. When price action eventually navigates back to touch a naked POC, traders closely monitor the immediate behavioral reaction of the market. A swift and aggressive price rejection at the level typically signals that the historical agreement no longer holds validity and that market participants are actively rejecting that price point under current conditions. Conversely, a prolonged period of time and heavy volume consolidation building directly around the level suggests that the market is beginning to accept that price once again, potentially laying the foundation for structural acceptance or continuation patterns.
Analysts also note that the exact numerical value of a POC can vary depending on the specific bin size utilized and the underlying data source feeding the chart. Exchange-specific data feeds, such as those derived from individual major cryptocurrency platforms, can occasionally exhibit minor discrepancies when compared against consolidated or aggregated market feeds, underscoring the importance of consistency in analytical frameworks. As market technicians continue to refine their approaches to auction market theory, attention frequently shifts toward broader concepts involving market acceptance and rejection at the outer boundaries of established value areas.
 Crypto Investing & Trading
 Crypto Investing & Trading
 Crypto Investing & Trading