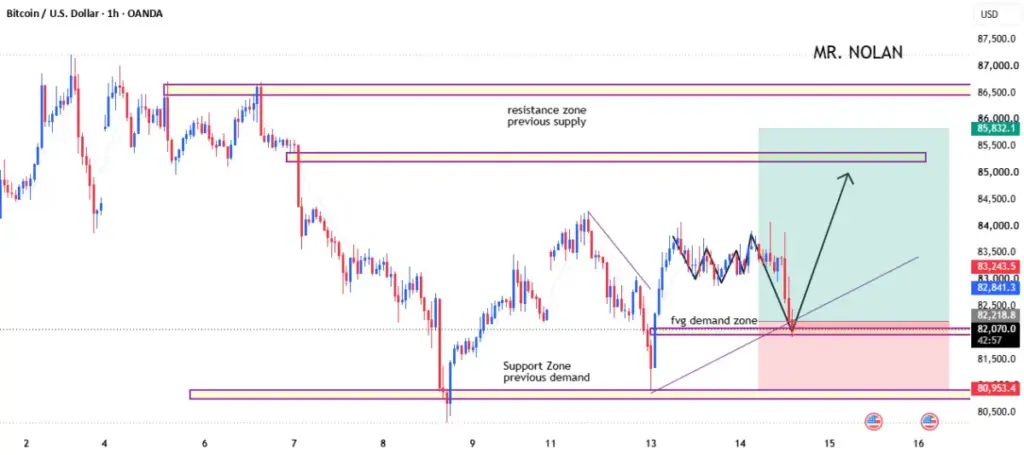
Bitcoin is currently navigating a pivotal juncture on its 1-hour timeframe, with market participants closely monitoring a high-confluence zone defined by a Fair Value Gap (FVG), a rising trendline, and previous historical demand. Following a sharp bearish correction from upper resistance levels, the leading cryptocurrency has entered a phase of consolidation, prompting analysts to evaluate whether buyers can muster enough momentum to reclaim market control and trigger a sustained upward move.
The recent price action follows a strong downward impulse that brought the asset down from higher resistance barriers. After reaching a robust previous demand zone situated near the 80,950 level, Bitcoin managed to stage a recovery, subsequently transitioning into a sideways trading pattern. Recent 1-hour candles reflect tight consolidation primarily confined between the 82,800 and 83,500 range. This localized stabilization has shifted market focus toward whether incoming buying pressure will be sufficient to establish a durable floor and fend off further downside pressure.
At the core of the current technical setup is an identified Fair Value Gap demand zone spanning the 82,100 to 82,200 bracket. Market analysts emphasize that this specific area serves as an important psychological and structural checkpoint where price frequently pauses or reacts before charting its next directional path. Rather than treating a touch of the FVG as an automatic trigger to open long positions, market participants are advised to closely observe localized candle reactions, rejection wicks, and the velocity of incoming buying pressure as the asset tests the region.
Adding weight to this localized demand area is a converging rising trendline that intersects directly with the FVG parameters. This overlapping dynamic creates a classic technical confluence zone, which traditionally attracts heightened attention from technical traders. However, market veterans continually caution that trendlines are inherently susceptible to breaches, meaning that live price action and confirmed market behavior must always take precedence over static chart assumptions.
Beneath the immediate FVG and trendline confluence lies a deeper structural safety net. The lower support zone resting between 80,950 and 81,000 marks a significant historical demand area where buyers previously engineered a strong defensive reaction. Should the current FVG fail to absorb selling pressure and successfully hold the price, market attention is expected to pivot back toward this lower threshold. A decisive break beneath this foundational support would significantly undermine the prevailing bullish hypothesis and necessitate a comprehensive reassessment of the near-term market structure.
For a credible bullish continuation scenario to materialize, market observers are watching for distinct confirmation signals. These include the appearance of a strong bullish candlestick formation, a decisive break above a recent local high, or a definitive Market Structure Shift. Furthermore, a successful retest of the demand zone following such confirmation is widely viewed as a prerequisite for establishing a structurally sound long position. Conversely, if Bitcoin continues to print lower highs or breaks decisively through the marked support boundaries, forcing bullish trades is strongly discouraged by risk management principles.
Should buyers successfully defend the FVG demand area and generate renewed upward momentum, chart analysis highlights several key resistance hurdles overhead. The initial significant resistance barrier is clustered around the 85,200 to 85,350 region. Beyond that immediate milestone, the next major overhead supply zone sits between 86,500 and 86,650. These levels are derived directly from historical price interactions on the chart and represent areas where profit-taking or renewed selling pressure could materialize rather than guaranteed price targets.
Underpinning any technical evaluation of the current setup is a strict adherence to fundamental risk management practices. While the chart illustrates a conditional long-position scenario, actual trade entries and stop-loss placements must be derived directly from live, confirmed price action rather than blind reliance on static zones. Analysts consistently remind market participants to limit risk exposure to a conservative percentage of total account equity per trade, calculate appropriate position sizes, and carefully evaluate the risk-to-reward ratio prior to executing any order. The overarching educational takeaway from the current market behavior is that technical markers such as Fair Value Gaps, demand zones, and trendlines should function strictly as areas for observation and analysis rather than autonomous, guaranteed entry signals. As the market develops, the validation of this conditional bullish scenario remains entirely dependent on whether buyers can successfully defend key structural boundaries and establish verifiable momentum.
 Crypto Investing & Trading
 Crypto Investing & Trading
 Crypto Investing & Trading