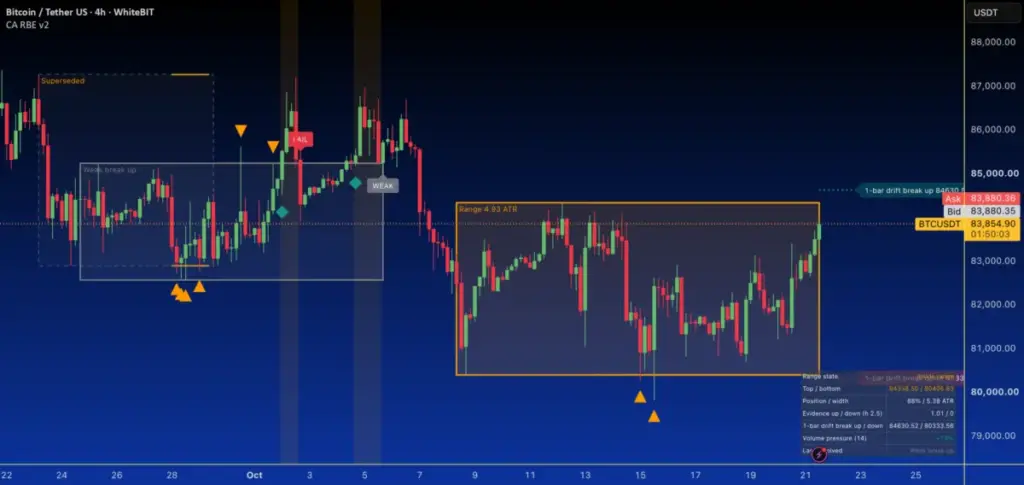
Bitcoin has found itself locked in a persistent and tightly defined trading channel for two weeks, leaving market participants waiting for a decisive directional move while managing the growing temptation of premature entries. Since a sharp market flush occurred between October 7 and October 8, the leading cryptocurrency has been trapped within a horizontal box, establishing a clear lower boundary near $80,400 and an upper resistance ceiling around $84,300.
Currently changing hands at approximately $82,060, Bitcoin is hovering directly in the dead center of this established range. This neutral positioning has ignited predictable excitement across social media platforms and trading desks, where market participants with fingers hovering over buy buttons are already typing out predictions of an impending breakout. However, seasoned technical analysts urge caution, pointing out that historical precedent from earlier in the month suggests these mid-range enthusiasm spikes often precede frustrating fakeouts rather than sustained bullish momentum.
The skepticism surrounding the current market structure is rooted in recent price action that bears a striking resemblance to early October setups. During that period, Bitcoin established a similar consolidation pattern higher up on the chart. The asset initially managed to push above its designated range, only to fail shortly thereafter. A subsequent push on October 5 resulted in a stagnant price action characterized by a complete lack of follow-through energy. Automated trading scripts and momentum indicators flagged that move as a weak breakout, a diagnosis that was validated just 48 days later when the market experienced a sharp dump from the $86,000 region down into the low $81,000s. Because of this recent memory, simple claims that Bitcoin has managed to "close above resistance" are failing to impress wary market participants who demand higher confirmation thresholds.
Despite the prevailing chop, the boundaries of the current range have been thoroughly tested, providing structural definition for both bulls and bears. The lower floor of the channel underwent a rigorous examination on October 15, when price action registered two distinct wicks down into the $79,900 to $80,000 zone. On both occasions, the candles managed to close back inside the established range, forming a classic stop hunt that cleared out leveraged long positions before responsive buyers stepped in to drag the asset back toward the middle of the channel. While this defense of the floor demonstrates underlying demand, the internal mechanics of the move leave much to be desired from a momentum perspective. Quantitative momentum gauges currently register a meager reading of 0.27 out of the preferred 2.5 threshold typically required to validate a legitimate, high-conviction breakout. In trading terms, the current momentum reading is essentially a nap, signaling an absence of the aggressive volume needed to sustain a directional trend.
Navigating this sideways environment requires strict discipline and clearly defined invalidation levels rather than emotional reactions to minor price fluctuations. A pragmatic approach to the current setup involves waiting for substantive confirmation on higher timeframe charts, such as the 4-hour interval. A 4-hour candle close just marginally above $84,400 warrants nothing more than probation, as marginal breaches remain highly susceptible to immediate reversal. Instead, a candle closing decisively near $84,600 or higher represents the type of structural shift that actually signals serious buyer intent. Should an attempted push turn out to be a fakeout that quickly retreats back inside the established box, the scenario would mirror the unwelcome rerun witnessed back in September, signaling an immediate exit for cautious longs.
Conversely, the downside parameters offer a mirror image of the bullish criteria, requiring a clean, definitive close under approximately $80,300 accompanied by genuine selling pressure rather than another deceptive wick that quickly reverses. Until either of these definitive boundary conditions are met, the middle of the range remains defined by erratic chop and sideways friction, encouraging patient observers to sit on their hands rather than force trades in an indecisive market. As market participants debate whether to front-run the current consolidation or wait patiently for the $84,300 resistance level to genuinely flip into support, the broader technical landscape serves as a reminder that ranges can ultimately break in either direction. Maintaining sensible position sizing, defining strict invalidation points, and preparing for unexpected volatility remain essential practices for navigating Bitcoin’s current holding pattern.
Disclaimer
The information and publications are not meant to be, and do not constitute, financial, investment, trading, or other types of advice or recommendations supplied or endorsed by TradingView.
 Crypto Investing & Trading
 Crypto Investing & Trading
 Crypto Investing & Trading