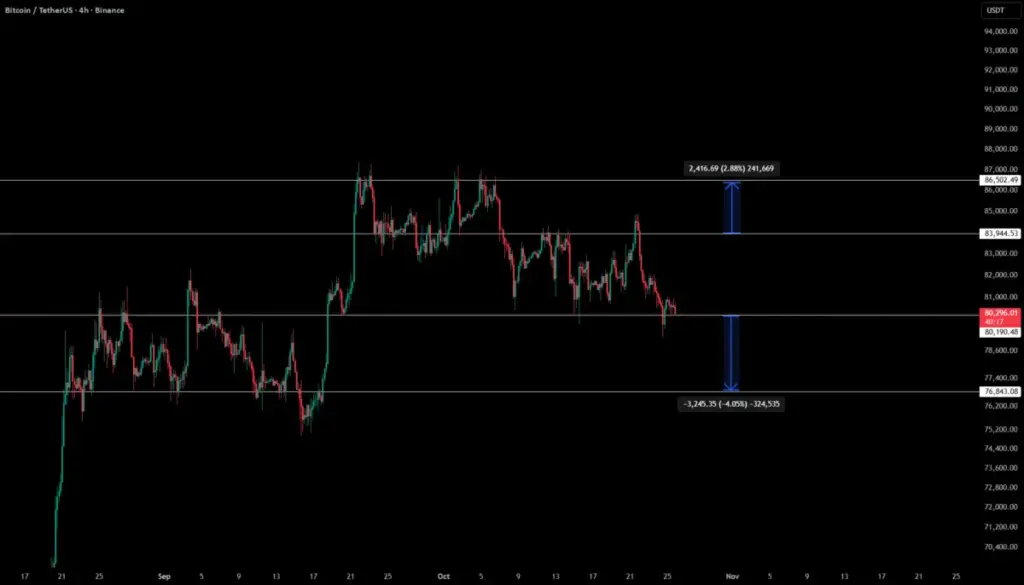
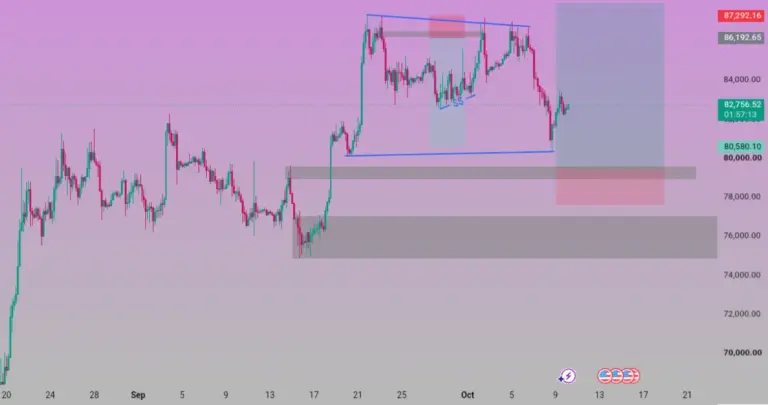
The cryptocurrency market is currently holding its breath as Bitcoin enters a tight consolidation phase across the four-hour timeframe, with traders and market participants bracing for a significant volatility expansion. As the flagship digital asset moves sideways within a well-defined trading range, price action has gravitated toward a pivotal historical support level, identified by market analysts as a crucial technical boundary that has successfully repelled downward pressure on multiple previous occasions.
Technical observers note that the market is currently coiling, a classic price action phenomenon where a contracting trading range typically precedes a sharp, directional breakout. This compression of price action suggests that market participants are reaching a temporary equilibrium, with neither buyers nor bulls managing to secure a decisive advantage over the medium-term timeframe. However, historical precedent in digital asset markets dictates that such prolonged periods of consolidation are rarely sustained indefinitely, often culminating in an explosive movement once the established boundaries are breached.
To prepare for the impending market shift, analysts are utilizing standard measured move projections based on the total height of the current trading range to map out potential price targets upon a breakout. These quantitative projections provide clear directional roadmaps for both bullish and bearish market participants as they monitor the evolving chart dynamics.
Under the primary bullish scenario, market focus remains fixed on the upper boundary of the current range. A confirmed four-hour candle close above this resistance ceiling would signal a resurgence of buying momentum, potentially invalidating the recent sideways drift. According to current measured move calculations, such a breakout could trigger an upward price trajectory toward a targeted gain of approximately 2.88 percent, translating to an estimated upward movement of roughly $2,416 from the breakout zone. This optimistic outlook hinges on sustained volume and broader market participation to ensure that any push above the range is not merely a temporary deviation or fakeout.
Conversely, the market faces mounting downside risks if the foundational support level fails to hold. A definitive breakdown below the current support zone—marked by a prominent red dotted line on technical charts—would likely accelerate selling pressure across the board. In this bearish environment, sidelined sellers could re-enter the market with force, driving the cryptocurrency toward a calculated downside target of approximately 4.05 percent. Based on current valuations, this downward projection represents an estimated loss of roughly $3,245, which could test lower liquidity pools and shake out leveraged long positions established during the recent consolidation phase.
As the cryptocurrency navigates this delicate technical crossroad, market participants continue to monitor order book depth, trading volumes, and broader macroeconomic sentiment for clues regarding the asset’s next major directional move. Whether the bulls manage to defend support and launch an assault on upper resistance, or whether sellers succeed in triggering a breakdown of key structural levels, the prevailing market compression suggests that a resolution is fast approaching.
Disclaimer
The information and publications are not meant to be, and do not constitute, financial, investment, trading, or other types of advice or recommendations supplied or endorsed by TradingView.
 Crypto Investing & Trading
 Crypto Investing & Trading
 Crypto Investing & Trading