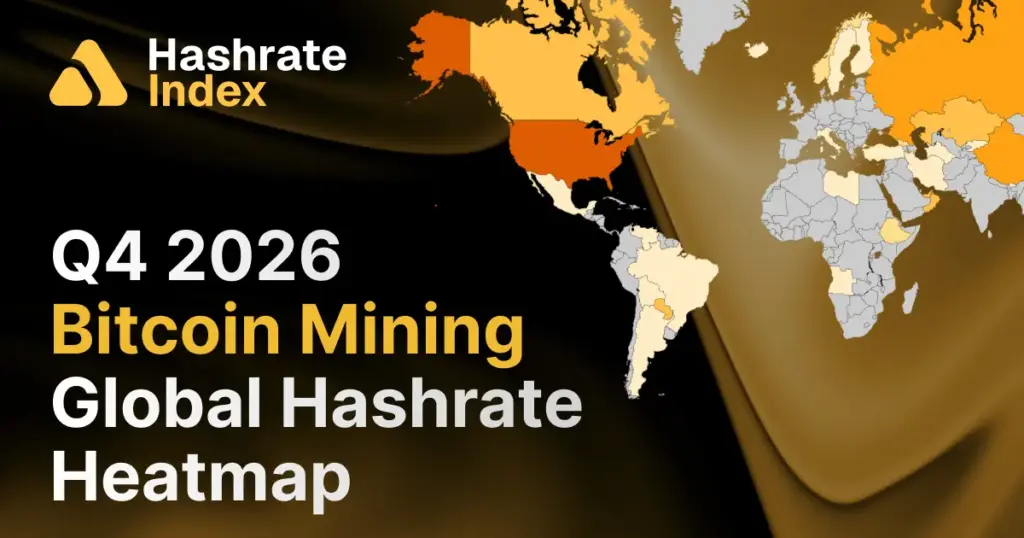
After two consecutive quarters of contraction, the Bitcoin network’s hashrate has finally halted its downward spiral. According to the Q4 2026 update of the Hashrate Index Global Hashrate Heatmap, global compute power finished the third quarter at approximately 941 EH/s, remaining effectively flat compared to the ~940 EH/s recorded in Q2.
While a flat headline figure suggests a period of relative calm, it masks an exceptionally dynamic quarter characterized by a profound redistribution of mining compute across the globe. Major shifts during the period included the United States shedding another 10 EH/s, Russia expanding by 8 EH/s, Ethiopia surrendering a third of its total hashrate due to severe environmental pressures, and Pakistan more than tripling its capacity.
Although the global map is no longer shrinking, the underlying architecture of Bitcoin mining continues to adapt rapidly to changing macroeconomic conditions, power availability, and the intensifying competition from artificial intelligence and high-performance computing (AI/HPC) sectors.
From Falling to Flat
The stabilization of the 30-day simple moving average at ~941 EH/s marks the first quarter in 2026 where the network hashrate did not register a decline. However, market observers emphasize that a flat quarter is not synonymous with a full recovery. The network remains roughly 8.7% smaller than it was a year prior, when it stood at approximately 1,031 EH/s in Q4 2025, and sits about 15% below its all-time peak reached in November 2025.
The primary driver behind this stabilization is that the rate of the industry-wide bleed has slowed. Marginal machines and older-generation ASICs that were economically unviable at prevailing hashprices have largely been powered down. Simultaneously, network difficulty has adjusted downward sufficiently to allow surviving operators to remain profitable.
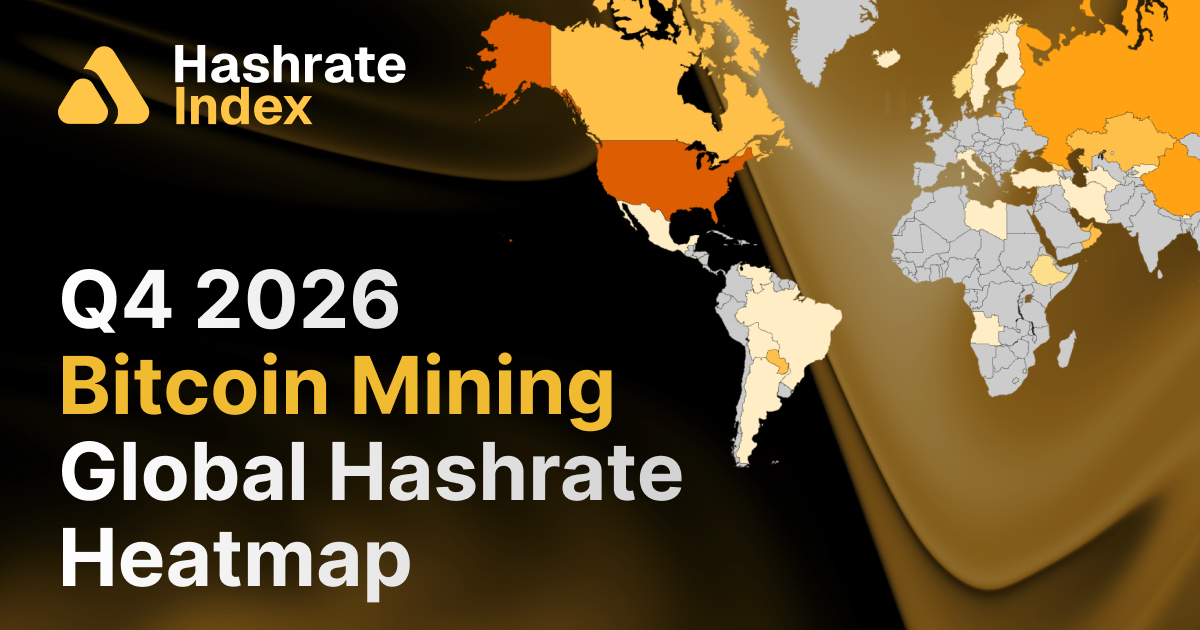
With the macro-bleed temporarily paused, the most compelling developments have unfolded at the country level. Five major nations experienced hashrate swings of more than 4 EH/s in either direction during the quarter. In a period where the total network compute barely budged, this represents a pure redistribution of Bitcoin’s global infrastructure.
Concentration Shifts and Quarter-over-Quarter Movers
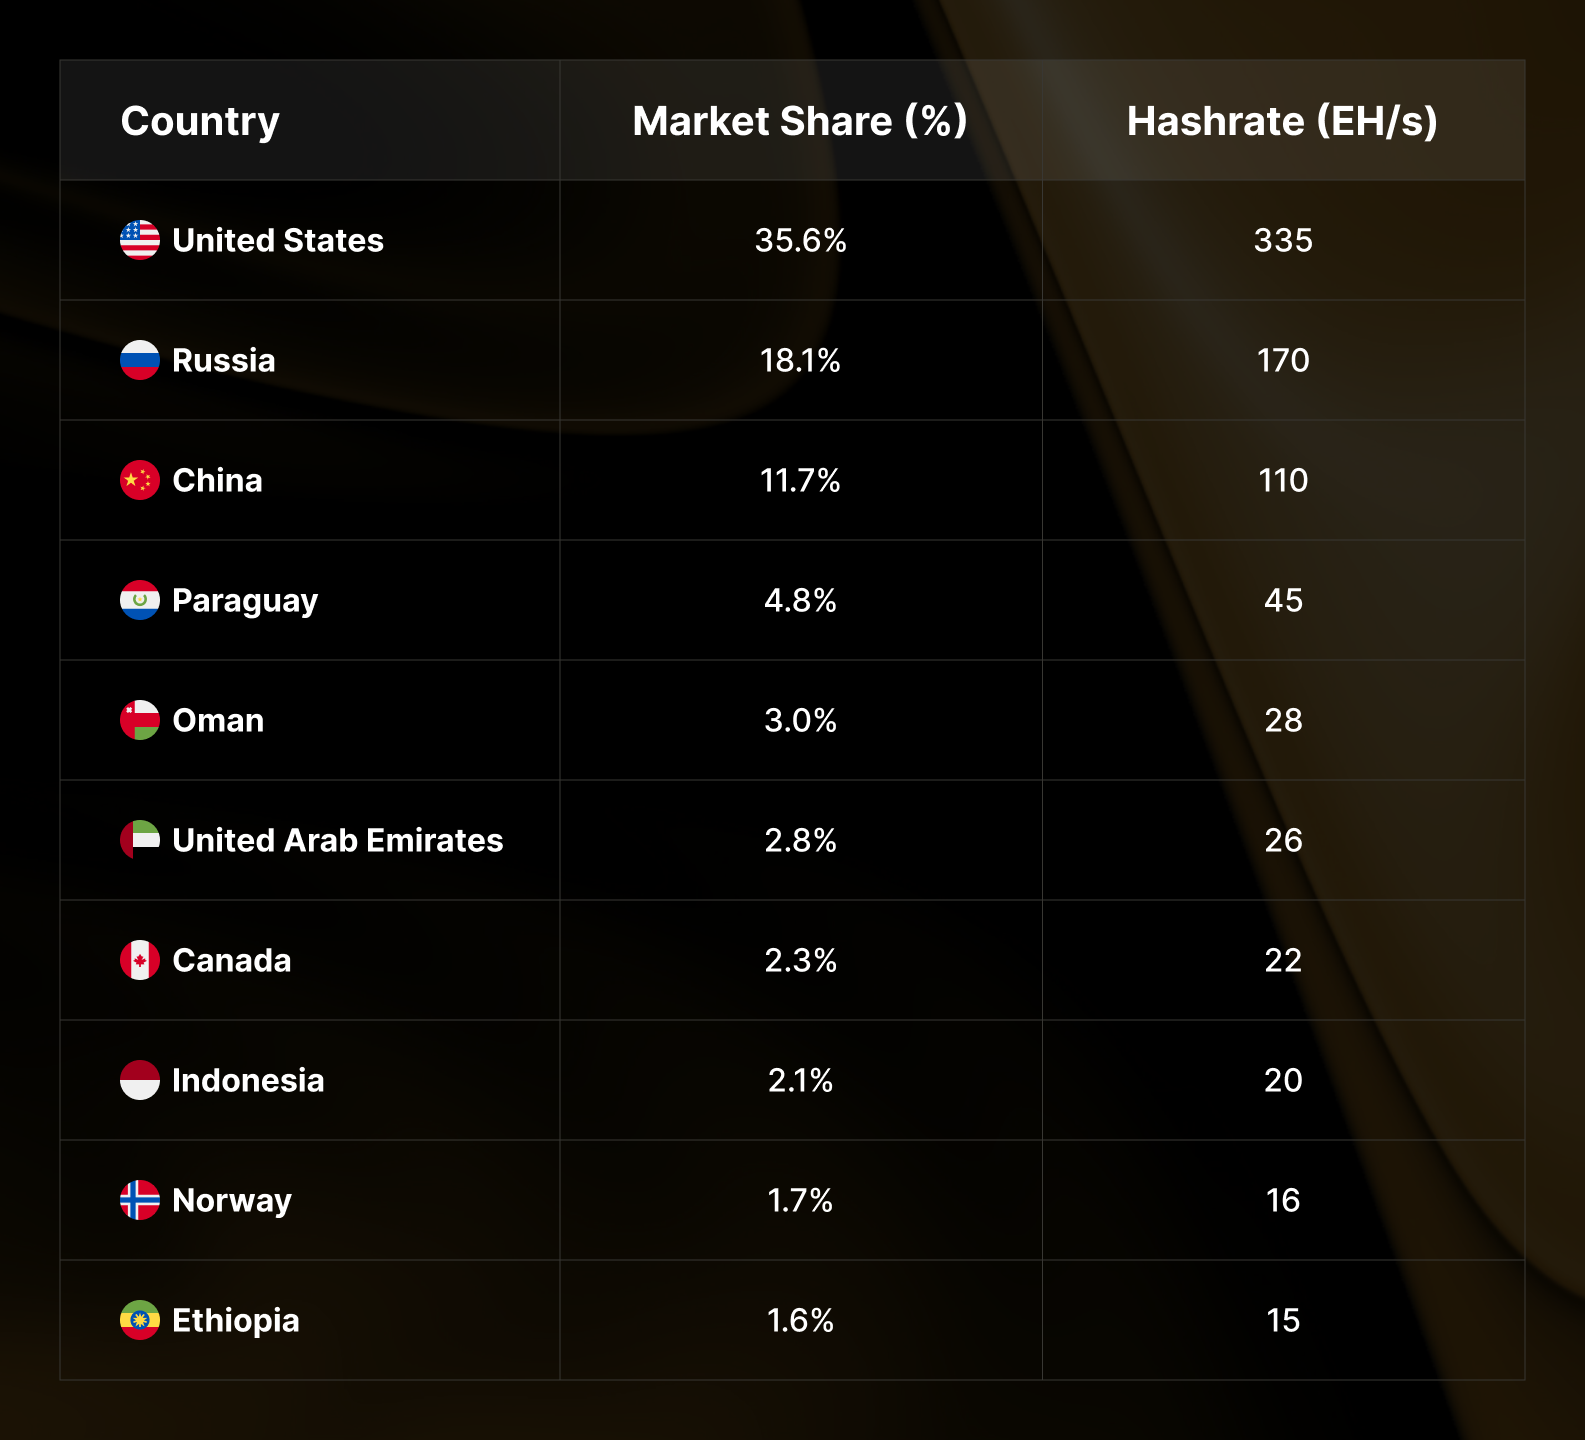
Bitcoin mining remains a highly concentrated industry, with the top three countries continuing to command roughly two-thirds of the global hashrate. However, the exact composition of the global leaderboard is evolving. Oman climbed past the United Arab Emirates to secure the fifth position globally, while Indonesia advanced from ninth to eighth place on the back of a genuine 3 EH/s gain. Conversely, Ethiopia slipped from eighth to tenth, while Kazakhstan held steady at the eleventh spot with roughly 15 EH/s, leaving it virtually tied with Ethiopia for the final top-ten slot heading into the new year.
Top-three concentration slipped slightly from 66.2% to 65.4%, marking the second consecutive quarterly decline. This trend indicates that the United States is relinquishing its dominant market share faster than Russia—its closest competitor—is absorbing it.
A comparative analysis of the quarter splits the global map cleanly between a shrinking developed core and a rapidly expanding frontier. On the declining side, traditional powerhouses saw continued reductions as operators optimized their footprints or repurposed infrastructure. Conversely, the gainers were not merely rounding errors. Pakistan’s addition of 5.5 EH/s represents the largest absolute step change in its history, while Venezuela’s growth of 4 EH/s pushes its total market size to approximately 10 EH/s, placing it ahead of established mining jurisdictions such as Laos, Finland, and Malaysia.
The Long View and the AI Pivot
Examining year-over-year figures helps strip away short-term quarterly noise to reveal durable structural trends. The twelve-month perspective demonstrates that virtually every market experiencing sustained growth is anchored in low-cost or stranded energy sources.
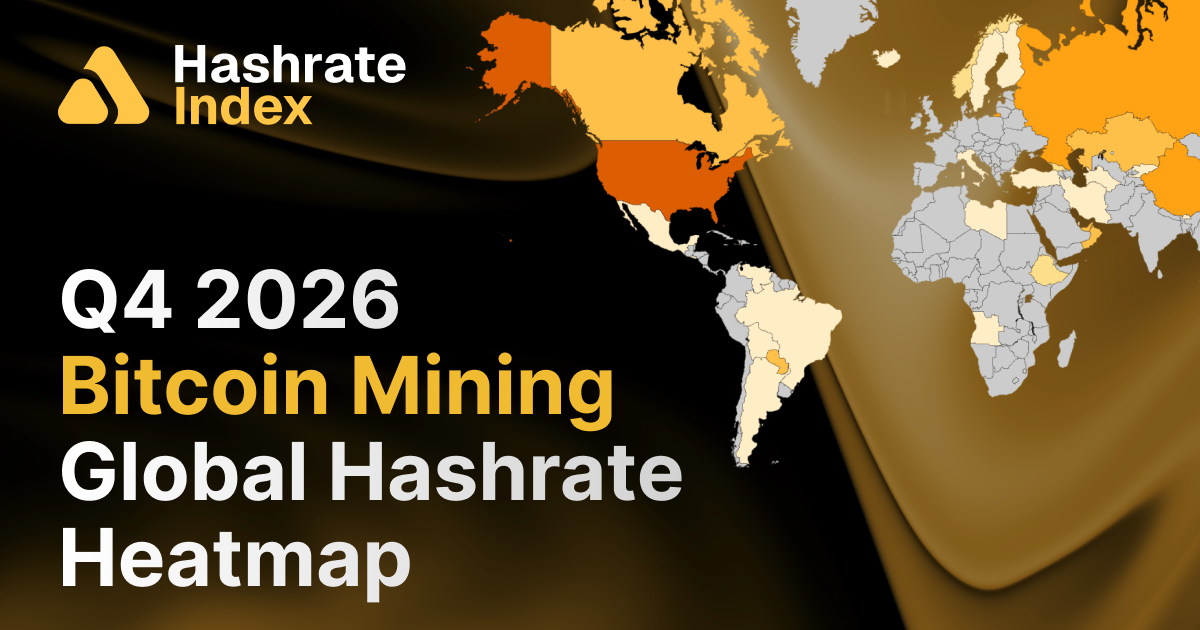
However, the declining markets do not present a simple mirror image of this trend. Traditional jurisdictions like Canada and the United Arab Emirates do not suffer from prohibitively expensive electricity; Canadian hashrate relies heavily on hydroelectric power in Quebec, Manitoba, and British Columbia, while Abu Dhabi benefits from diverse energy supplies including natural gas, solar, and nuclear power.
These markets shed hashrate not because energy became unaffordable, but because the power infrastructure found a more lucrative application. Both jurisdictions host sophisticated mining operators that are well-advanced in the pivot toward artificial intelligence and high-performance computing that defined much of 2026. The economic disparity between the two sectors is stark: AI and high-performance computing workloads routinely generate anywhere from $1,500 to $3,500 per megawatt-hour, whereas traditional Bitcoin mining yields a significantly lower range of $50 to $150 per megawatt-hour.
This distinction holds critical implications for the future distribution of compute power. While a marginal mining machine that goes offline due to a drop in hashprice can easily be brought back online if market conditions improve, power capacity permanently contracted to a multi-year AI tenant cannot be reclaimed, even in the event of a significant Bitcoin rally and downward difficulty adjustments. Consequently, the global decliners are splitting across three distinct categories: capacity converting to AI and high-performance computing infrastructure in the United States, Canada, and the UAE; regulatory pressures in countries like Kazakhstan, China, and Iran; and macroeconomic instability in markets such as Argentina.
Standouts and the Ethiopian Hydroelectric Crunch
Among the jurisdictions defying the broader contraction, Paraguay continues to anchor the group growing through the down-cycle, adding another 1 EH/s to reach roughly 45 EH/s—securing the fourth global ranking with a 12% year-over-year increase fueled by Itaipú hydropower. Similarly, Indonesia stands out as a clear structural gainer, reaching approximately 20 EH/s and a top-eight slot with an 18% annual increase driven by Southeast Asian hydro diversification. Norway, meanwhile, has maintained a remarkably stable output of approximately 16 EH/s for four consecutive quarters.
The most dramatic reversal of the period, however, occurred in Ethiopia. The East African nation experienced a sharp decline from roughly 23 EH/s down to 15 EH/s, representing a 35% quarterly drop that pushed the country from the eighth to the tenth global ranking and returned its metrics to mid-2025 levels. Measured from its peak of 27.5 EH/s earlier in the year, the market has contracted by 45% in just three quarters.
This contraction was not the result of a policy reversal, but rather an environmental crisis. On September 15, Ethiopian Electric Power drastically curtailed electricity supplies to Bitcoin miners, reducing deliveries to approximately 23% of contracted volume—a reduction of roughly 75%. The emergency curtailment was triggered after reservoir inflows plummeted by about 20% due to severe El Niño-driven dry conditions. Because Ethiopia’s entire mining ecosystem relies almost exclusively on centralized hydroelectric generation without diversified fossil or renewable backups, the industry absorbed the full brunt of the hydrological shortfall.
Regional Dynamics Across the Globe
In North America, the United States remains the undisputed market leader with a 35.6% global share, yet it recorded its third consecutive quarterly decline, sliding to approximately 335 EH/s—a 14% year-over-year decrease from its peak of 400 EH/s earlier in the year. Canada continued its downward trajectory, dropping to 22 EH/s to register the sharpest annual decline among developed markets at 27%.
Across Europe and Central Asia, Russia emerged as the quarter’s largest absolute gainer, adding 8 EH/s to reach approximately 170 EH/s and capturing an 18.1% global market share. Kazakhstan successfully stabilized around 15 EH/s following a protracted period of losses, while Norway and Georgia held firm at 16 EH/s and 11 EH/s, respectively.
In the Asia-Pacific region, China’s compute capacity continued its gradual multi-quarter erosion, easing to approximately 110 EH/s, down 24% year-over-year. Regional diversification continued to benefit Southeast Asia, with Indonesia reaching 20 EH/s and Malaysia climbing to 7 EH/s, while Laos expanded by 1 EH/s to touch 9 EH/s.
The Middle East saw Oman reverse its previous trajectory by adding 2 EH/s to reach 28 EH/s, thereby surpassing the UAE, which dipped to 26 EH/s amid ongoing domestic shifts toward high-performance computing. Meanwhile, Iran posted a modest recovery, ticking up to 3 EH/s for its first upward movement since regional geopolitical tensions escalated earlier in the year.
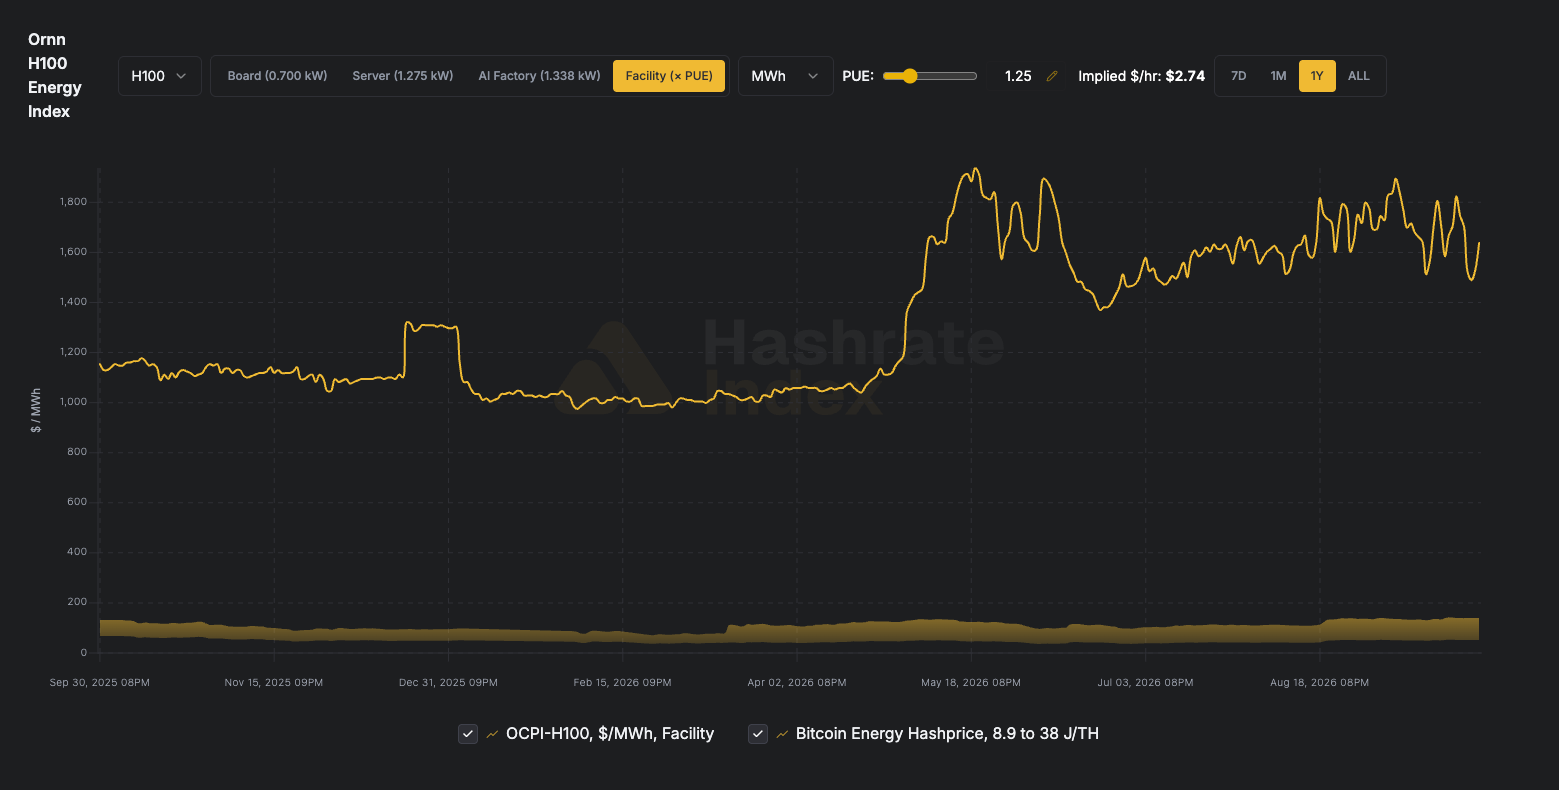
Latin America’s landscape is led by Paraguay’s steady expansion, alongside Venezuela’s notable climb to 10 EH/s despite a formal state prohibition on mining that has remained in place since mid-2024. Observers note that surviving Venezuelan operations largely operate on an informal or semi-legitimate basis. Bolivia also saw modest growth to 4 EH/s, while Argentina experienced continued declines due to ongoing macroeconomic headwinds.
Finally, the African continent saw its flagship mining sector in Ethiopia contract sharply due to the aforementioned hydroelectric shortages, leaving no other regional market large enough to offset the sudden deficit.
 Cryptocurrency Mining
 Cryptocurrency Mining
 Cryptocurrency Mining