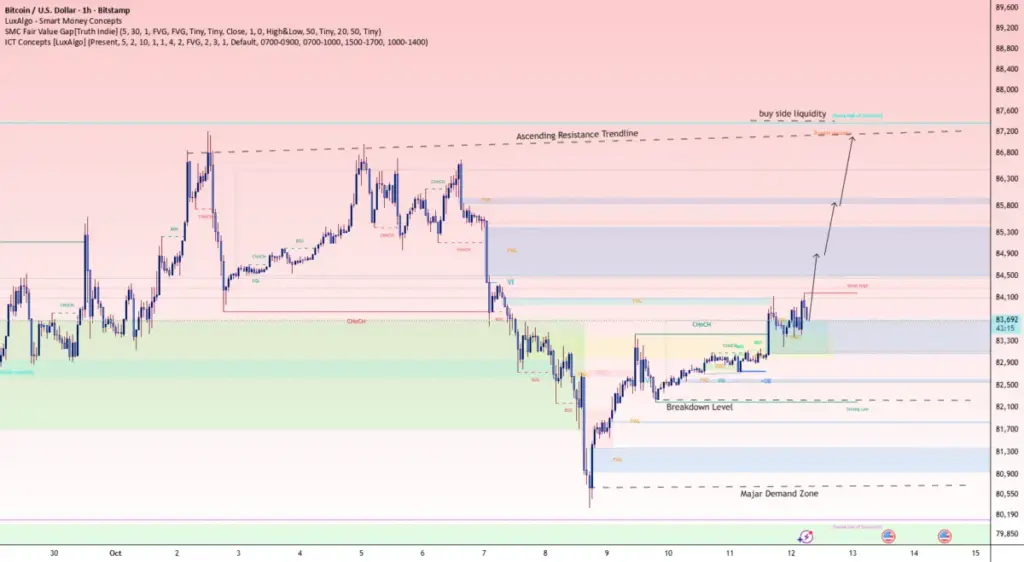
Bitcoin is currently navigating a critical juncture on the hourly charts, attempting to sustain a recovery rally after finding significant buying interest at a lower demand zone. As the market consolidates around the $83,800 threshold, traders and market participants are closely monitoring a series of tightly clustered resistance and support levels. While the latest price action hints at a developing bullish recovery structure, analysts emphasize that further upside remains conditional. Bitcoin must successfully reclaim and hold several key overhead supply zones before any continuation of the broader trend can be confirmed.
The recent price trajectory highlights the delicate balance between buying momentum and overhead selling pressure in the cryptocurrency market. Following a corrective downward phase, Bitcoin’s price sharply reversed upon entering a heavily defended major demand zone. This dynamic underscores the ongoing battle between market participants looking to accumulate assets at local lows and those seeking to realize profits or establish short positions near historical resistance barriers.
Major Demand Zone Sets the Foundation for Recovery
The foundation of the current hourly market structure lies within a major demand zone spanning from $80,500 to $81,000. During the preceding decline, this region served as a crucial shock absorber where robust buying activity materialized, halting the downward momentum and sparking an impulsive upward reaction. The intensity of the bounce from this corridor suggests that institutional or high-volume retail buyers still view dips into this area as attractive accumulation opportunities.
Market observers note that this zone will continue to serve as a vital litmus test for the health of the current market structure. Should macroeconomic pressures or sudden shifts in market sentiment drive Bitcoin back down toward the $80,500 to $81,000 range, the nature of the reaction will be telling. A strong, aggressive defense of the region would reinforce the viability of the current bullish recovery thesis. Conversely, a sustained, high-volume breakdown beneath this floor would invalidate the recovery scenario, exposing the market to deeper downside corrections and shifting control back to sellers.
Current Support and Short-Term Market Structure
In the immediate short term, Bitcoin is interacting with a local support region situated between $83,000 and $83,400. Maintaining a position above this band is essential for buyers attempting to construct a coherent, upward-sloping market structure on the 1-hour timeframe. As long as prices respect this immediate cushion, the market retains a short-term constructive bias, allowing bulls to consolidate gains and build energy for subsequent pushes higher.
However, financial markets remain inherently dynamic, and failure to hold immediate support often triggers algorithmic selling or stop-loss cascades. If Bitcoin slips below the $83,000 threshold and subsequently fails to reclaim the level during a relief bounce, it would signal a distinct loss of short-term momentum. Such a development would warn market participants that the recent recovery rally may be running out of steam, increasing the probability of a retest of lower structural floors.
Navigating the First Major Resistance Zone
As Bitcoin trades around the $83,800 mark, attention immediately shifts to the first significant overhead barrier located between $84,000 and $84,200. This zone represents an immediate hurdle that the cryptocurrency must decisively clear to prove that buyers maintain underlying control of the session.
A clear, high-volume break above this immediate resistance area, followed by a successful pullback and retest that establishes the former resistance as new support, would provide technical validation of renewed bullish intent. On the other hand, if the price encounters rejection within the $84,000 to $84,200 corridor, it could invite range-bound consolidation or a corrective slide back toward the foundational support levels. How price action behaves upon touching this initial barrier will heavily influence the direction of the subsequent hourly sessions.
Fair Value Gap and Upper Resistance Dynamics
Beyond the immediate resistance lies a more complex technical landscape defined by a fair value gap and a broader upper resistance zone spanning from $84,500 to $85,800. In modern market analysis, fair value gaps often act like magnets, drawing price toward them as markets seek to correct pricing imbalances created by previous aggressive moves.
If buyers manage to secure a firm foothold above the initial $84,200 threshold, the $84,500 to $85,800 zone becomes the primary area of interest. Analysts caution, however, that a simple spike into this region should not be misinterpreted as an automatic breakout confirmation. Fair value gaps and upper resistance areas frequently trigger sharp reactions, ranging from sudden pullbacks to protracted sideways churning as trapped liquidity is cleared out. Navigating this zone successfully requires patience and confirmation through sustained closes rather than impulsive wicks.
Buy-Side Liquidity and Ascending Trendline Objectives
Looking further up the chart, a more ambitious bullish objective comes into view around the $86,800 to $87,400 price band. This region coincides with an ascending resistance trendline and a notable concentration of buy-side liquidity. In technical analysis, liquidity pools above established highs often attract price action when strong upward momentum takes hold.
Reaching this higher objective remains a conditional scenario dependent on a sustained sequence of higher highs and higher lows. For this target to come into play, Bitcoin must methodically clear the intermediate resistance barriers, absorb existing sell orders, and maintain structural integrity across lower timeframes. Without this step-by-step progression, reaching the upper liquidity pools remains an unlikely prospect in the immediate term.
Evaluating the Bullish and Bearish Scenarios
The current market environment presents distinct pathways for both bulls and bears. The bullish scenario hinges on the cryptocurrency’s ability to defend the $83,000 to $83,400 support band, allowing buyers to cement a clear upward structure on the 1-hour chart. Under this outlook, a successful breakthrough and retest of the $84,000 to $84,200 level would pave the way for a test of the $84,500 to $85,800 resistance zone, with higher liquidity targets remaining viable only if broader market momentum persists.
Conversely, the bearish alternative activates if Bitcoin definitively loses the $83,000 support region and fails to reclaim it in subsequent trading periods. Such a failure would undermine the foundation of the current recovery rally, drawing renewed attention to lower structural support levels. In this scenario, the major demand zone situated between $80,500 and $81,000 would once again become the ultimate point of reference for assessing market stability.
Ultimately, BTCUSD is at a critical crossroads as it attempts to transition from a localized demand bounce into a sustainable upward trend. The next definitive move will be dictated by how price action reacts to the overlapping layers of support and resistance currently governing the hourly charts. While confirmed breakouts and successful retests would reinforce the bullish case, signs of rejection and a loss of key supports dictate a cautious approach. As always in the cryptocurrency sector, these technical levels serve as observation zones rather than guaranteed financial targets, requiring market participants to maintain strict risk management protocols amidst ongoing volatility.
 Crypto Investing & Trading
 Crypto Investing & Trading
 Crypto Investing & Trading