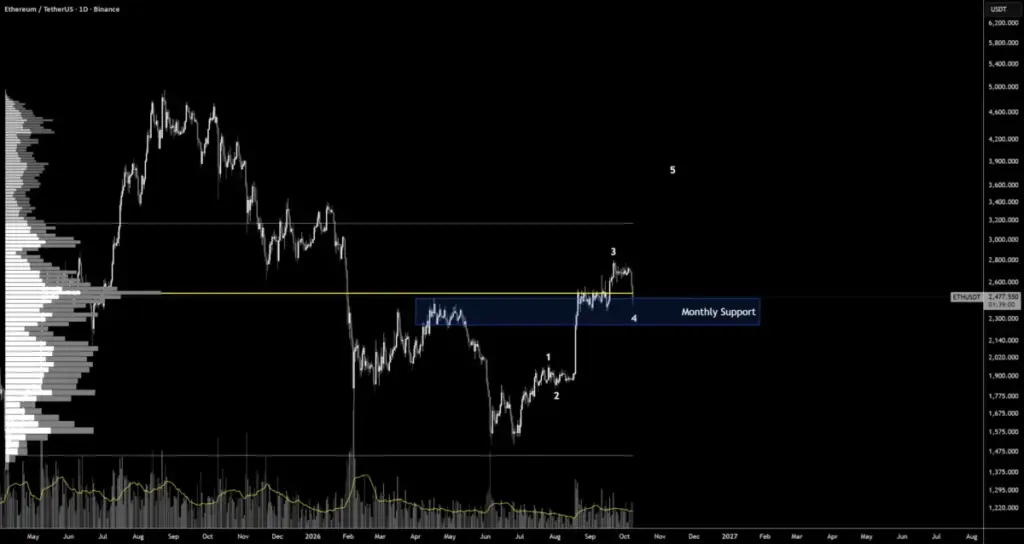
Ethereum’s price action against Tether on the daily chart has entered a critical juncture, drawing the focus of market analysts toward a high-stakes test of macro-level support. Zooming out to the daily timeframe reveals that the price structure is navigating a pivotal phase within a larger, developing five-wave Elliott Wave impulse pattern. This macro structure provides the essential context for understanding the current market pullback, anchoring short-term volatility to significant historical and structural levels that have defined Ethereum’s trajectory over previous months.
Tracing the origins of this multi-stage move, the foundational first wave of the impulse sequence commenced at the significant market low recorded in June, driving prices upward before culminating near the 1,965 level. Following this initial upward surge, a corrective second wave ensued, pulling the market back in a measured retracement that found a firm footing roughly around the 1,835 mark. Importantly, this pullback respected the structural rules governing the count, halting its descent well before threatening the origin point of the move.
What followed was the most expansive phase of the sequence, with wave three delivering a powerful, sustained rally that sliced decisively through the established historical trading range. This aggressive upward momentum carried prices to a peak near the 2,806 level, officially establishing wave three as the longest of the first three legs in the impulse sequence. Market participants who captured gains during this extended expansion are now witnessing the inevitable counter-cyclical cooling period, as the asset transitions into the fourth wave of the macro count.
The current daily session highlights the intensity of this ongoing corrective phase. Opening near the 2,574 mark, the active daily candle experienced sharp downward pressure, plunging to an intraday low of 2,406 before recovering slightly to hover around the 2,480 region. This notable intraday wick carried the price directly into a heavily defended monthly support block, which spans roughly from 2,250 to 2,460. Furthermore, this low dipped just beneath the 0.382 Fibonacci retracement level of the entire wave three advance, located near 2,435—a historically common depth and exhaustion zone for fourth-wave corrections in trending markets. Because the current daily candle has yet to officially close, market observers emphasize that the sharp downward wick represents a technical visit to the support zone rather than a confirmed final bottom.
Adding further analytical weight to this price territory is the underlying volume profile, which highlights significant market participation at current levels. The point of control, identified as the widest and most heavily traded node on the volume profile histogram, sits close to the 2,505 mark. Ethereum is currently trading directly inside this dense liquidity cluster. Market mechanics dictate that a high-volume node represents the price zone where the largest volume of inventory has changed hands, meaning that a massive concentration of market participants hold active stakes in the eventual outcome of this price test. Consequently, this dense area can only act as a reliable launchpad if committed buyers step in to defend the territory and absorb remaining selling pressure.
Evaluating the structural integrity of the move through the Continuation Acceleration Protocol yields a nuanced view of the market’s health. The first gate of the protocol, which evaluates macro market structure, remains firmly bullish so long as the developing wave four successfully avoids overlapping with the territory of wave one. According to the strict parameters of the count, a daily candle close falling below the critical threshold of approximately 1,965 would violate the core rules of the impulse structure, thereby invalidating the entire bullish wave count and forcing a reassessment of the broader market trend.
The second evaluation gate focuses on the active structural zone, encompassing the aforementioned monthly support block in conjunction with the high-volume point of control. While the current price action is testing the upper boundaries of this primary defensive area, additional layers of support loom beneath if selling pressure intensifies. Deeper downside protection is located at the 0.5 Fibonacci retracement level near the 2,320 mark, followed closely by the lower boundary of the monthly support block situated around 2,250.
In contrast, the third gate—which requires a definitive technical trigger—remains unconfirmed at this stage of the session. For the market to signal a successful defense of support, price action must accomplish two distinct reclamation tasks. The first requirement involves recovering the top of the monthly support block near the 2,460 level, a feat that today’s daily closing price will largely dictate. The second requirement is a decisive reclaim of the point of control situated near 2,505. Technical analysts note that a true market bottom is rarely established by a simple touch or wick into support; rather, it requires that initial visit to be followed by a confirmed reclaim of crucial overhead levels.
On the lower timeframes, such as the four-hour chart, this reclaim typically manifests as a change of character, marked by a decisive break above the initial lower high established during the downward descent. Experienced traders place their confidence in the subsequent structural retest that follows the initial change of character, rather than chasing the initial breakout candle itself.
Complete validation of the bullish thesis requires a verified change of character, a successful recapture of the 2,505 point of control, and a subsequent impulsive drive through the wave three peak at 2,806, which would officially inaugurate the fifth wave of the sequence. Analysts are intentionally withholding specific price targets for wave five until the ongoing fourth wave completes its retracement and definitively establishes its terminal point. Conversely, the immediate risk to the bullish bounce is clearly defined by a daily close below the lower boundary of the support block near 2,250, while the broader macro count itself fails entirely if prices break beneath 1,965.
Market psychology often dictates that the true purpose of an extended fourth wave is to wear down and exhaust the market participants who successfully capitalized on the gains of the previous third wave. Ultimately, the traders who manage to maintain a disciplined plan and retain their composure when the fifth wave finally begins are the ones whom market volatility was never designed to shake.
 Crypto Investing & Trading
 Crypto Investing & Trading
 Crypto Investing & Trading