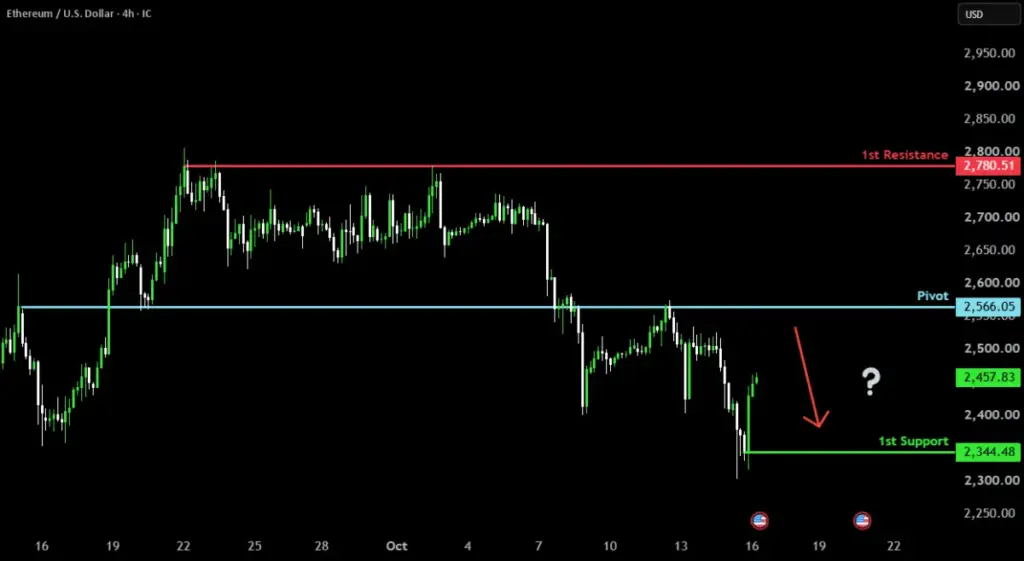
Ethereum, the world’s second-largest cryptocurrency by market capitalization, is currently on an upward trajectory against the US Dollar (ETH/USD), steadily climbing toward a crucial technical threshold that analysts have identified as a major pivot and overlap resistance zone. As market participants closely monitor price action across major crypto asset exchanges, trading desks are evaluating whether this bullish momentum will pierce through current barriers or encounter a strong rejection, which could trigger a downward retracement toward established pullback support levels.
The latest technical market commentary highlights a specific price structure developing around Ethereum’s valuation. According to market observations, the primary pivot level is firmly established at 2,566.05. This price point serves as a critical inflection zone due to its classification as an overlap resistance, where previous price action has historically encountered selling pressure or notable supply concentrations. As ETH trades higher in the session, market participants are paying close attention to how the asset behaves upon testing this precise numerical threshold.
Should the upward momentum stall near the pivot resistance, technical models suggest that Ethereum could experience a bearish reversal. In such a scenario, the correction path points toward the first major support level, identified at 2,344.48. This designated area functions as a pullback support, a region where buyers historically stepped in to absorb selling pressure and establish a floor for subsequent rallies. Conversely, if bullish sentiment proves overwhelming and buyers manage to decisively clear the pivot, the asset faces its next significant technical hurdle at the first resistance level, located at 2,780.51.
The ongoing price dynamics reflect the broader sentiment within the digital asset ecosystem, where traders continuously weigh macroeconomic factors against technical chart formations. Technical analysis tools, such as pivot points, support lines, and resistance barriers, remain widely utilized by both institutional and retail participants to navigate the inherent volatility of cryptocurrency markets. While these indicators offer a structured framework for anticipating potential market moves, traders frequently emphasize that no single metric can guarantee future performance in the fast-paced crypto trading environment.
As the market continues to develop, participants across various platforms are keeping a vigilant eye on volume indicators and order book depth around the 2,566.05 pivot. Whether Ethereum successfully breaks through its immediate overhead resistance or succumbs to a healthy correction toward the 2,344.48 support area will likely dictate the short-term directional bias for the token in the upcoming trading sessions. Market analysts note that broader economic conditions, shifting liquidity trends, and shifting risk appetites across global financial markets will continue to play a pivotal role in shaping cryptocurrency valuations alongside technical chart patterns.
 Crypto Investing & Trading
 Crypto Investing & Trading
 Crypto Investing & Trading