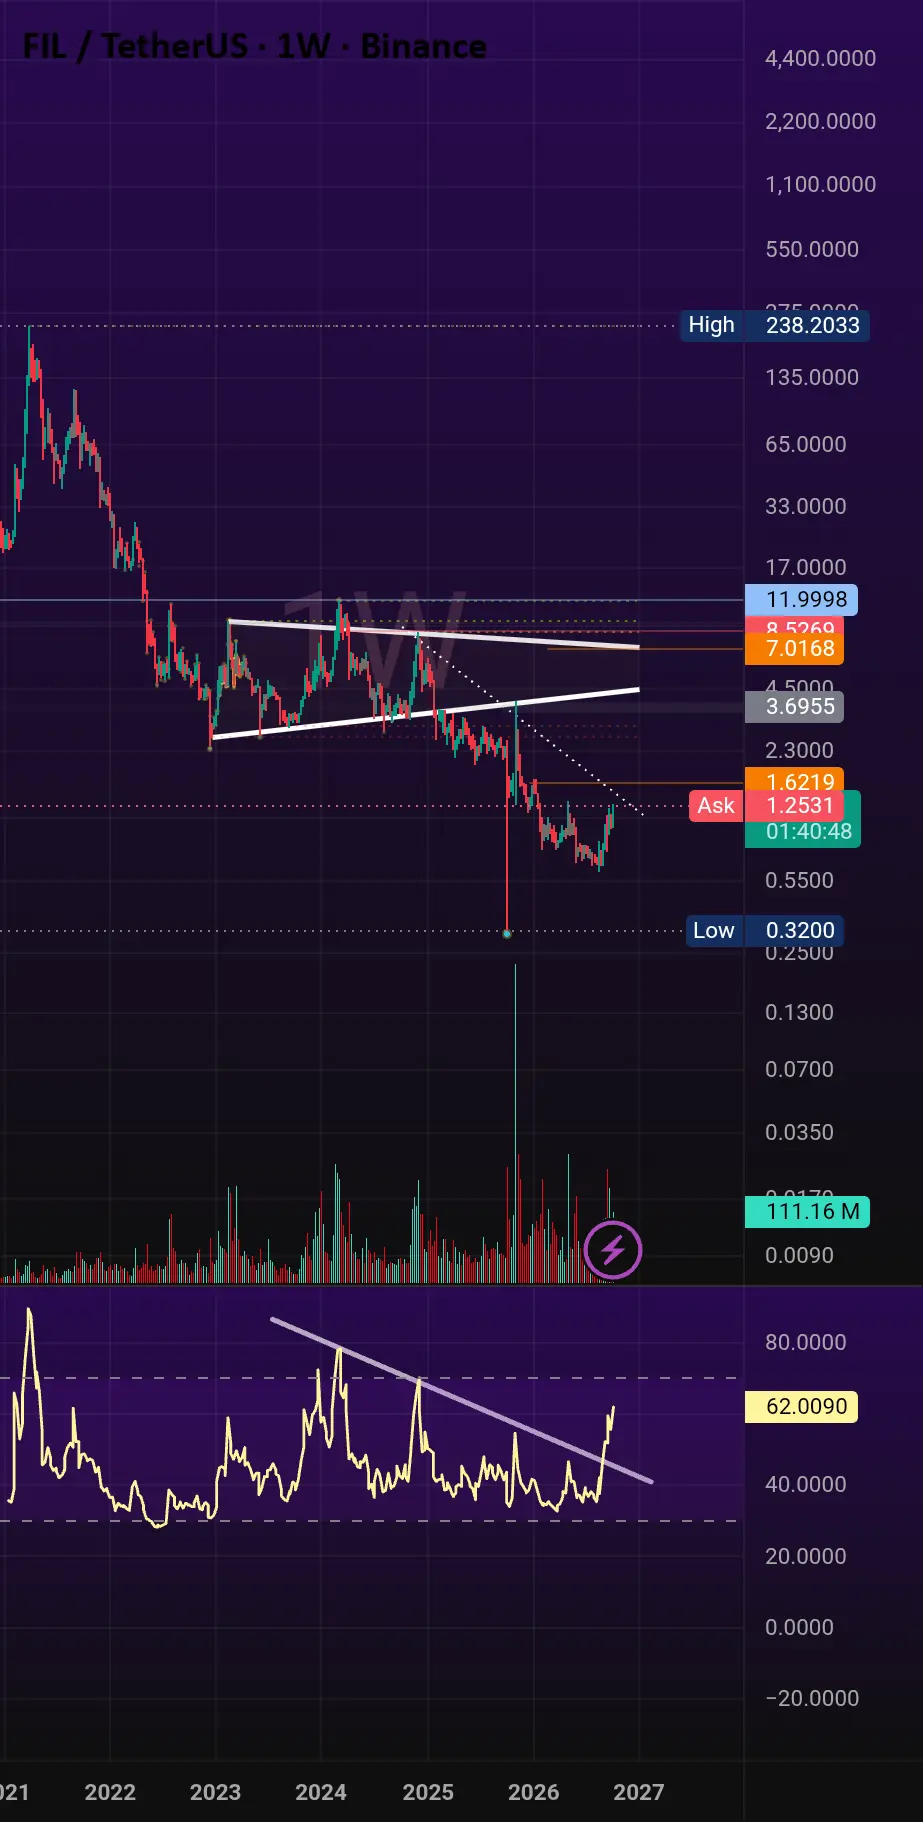
The weekly chart for Filecoin (FIL) has recently captured the attention of cryptocurrency market analysts as price action points toward a potential major trend reversal. Technical indicators on the weekly timeframe reveal a complex multi-year triangle formation that initially appeared to break down, trapping bearish traders before staging a dramatic recovery. This deceptive move, highlighted by a sharp wick down to the $0.32 region, is now being widely interpreted by market observers as a classic liquidity grab orchestrated by large market participants, commonly referred to as whales.
Following the sharp flash crash to $0.32, FIL experienced an aggressive price recovery, climbing back up to the $1.14 level. This swift rebound has fundamentally altered the short-to-medium-term technical landscape for the asset. Compounding the bullish sentiment of the price recovery is a confirmed breakout from a descending Relative Strength Index (RSI) downtrend. Together, these technical developments strongly signal that persistent selling pressure may finally be exhausted, clearing the path for bulls to attempt a sustained recovery rally across broader market timelines.
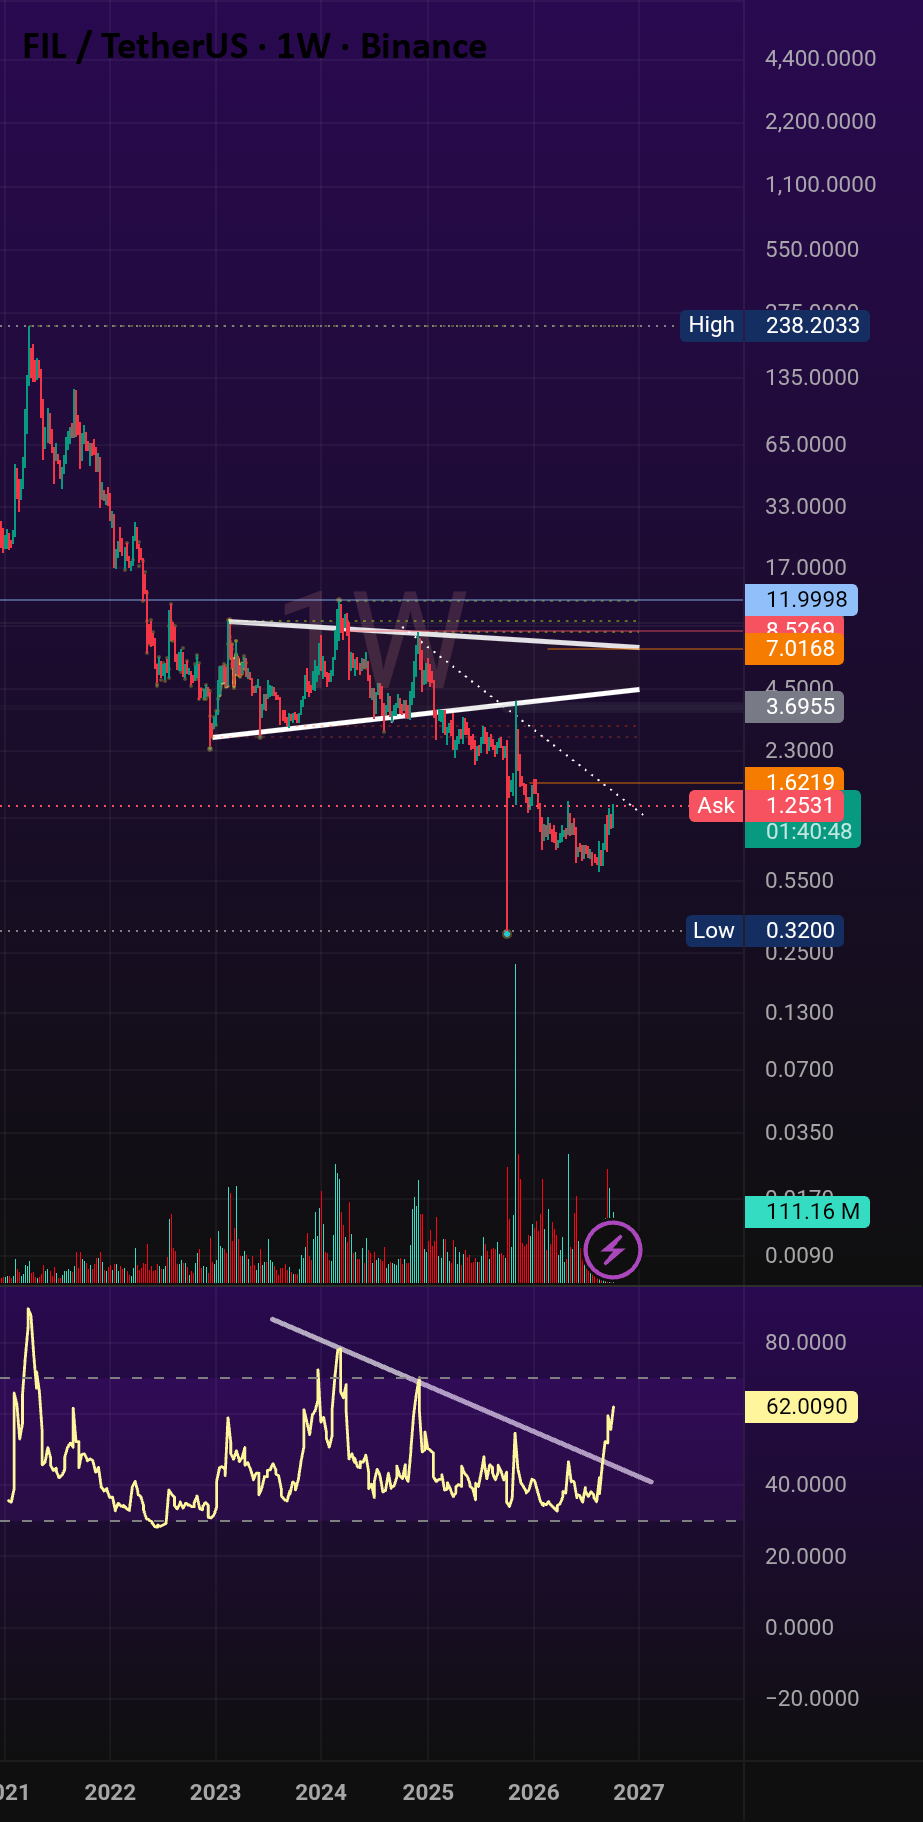
Market participants monitoring the weekly structure note that the ability of the asset to defend key support levels will be critical in determining the trajectory of the next macro move. Analysts focusing on support and resistance dynamics emphasize that if the psychological and technical threshold at $1.40 can hold securely as a support floor, the asset has a clear pathway toward higher upside price targets. Based on the geometry of the multi-year chart structures and historical resistance zones, the subsequent primary targets for FIL sit at $3.70, with a more ambitious extended target resting at $7.00 should broader market momentum align with the technical breakout.
The recent price action underscores the high volatility and complex market mechanics often observed in legacy altcoin charts, where multi-year technical patterns frequently undergo false breakdowns designed to sweep resting stop-loss orders and capture deep liquidity pools before a genuine directional move unfolds. As the asset consolidates near its recovery zones, traders and market analysts continue to track volume profiles and momentum indicators to verify whether the exhaustion of selling pressure will translate into sustained upward momentum toward the outlined multi-dollar resistance levels.
 Crypto Investing & Trading
 Crypto Investing & Trading
 Crypto Investing & Trading