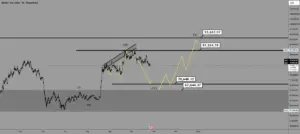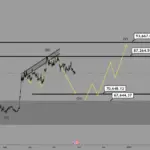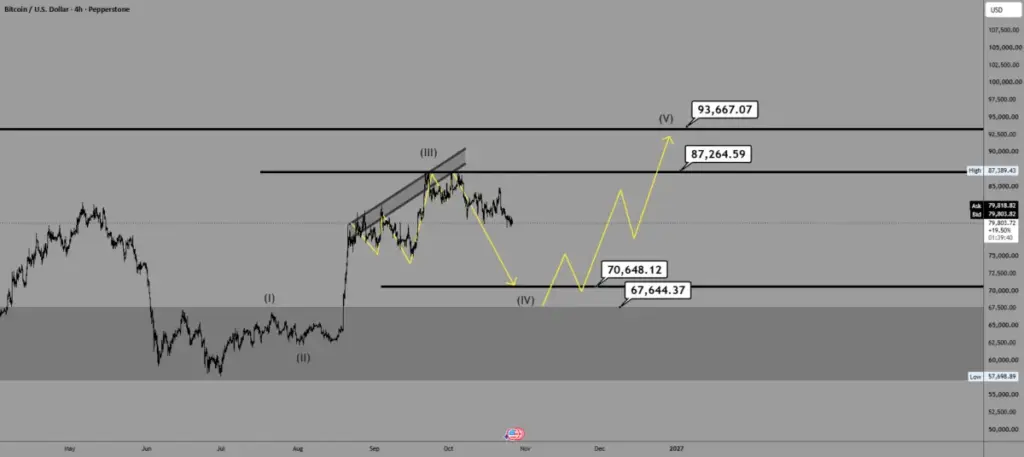
Bitcoin’s price action on the 4-hour chart has captured the attention of market analysts following a powerful impulsive structure that originated from the swing low of approximately $57,700. According to recent technical assessments of the leading cryptocurrency, this robust upward movement appears to have reached a local peak near the $87,200 threshold, where bulls encountered significant selling pressure and stiff market resistance. This rejection at the upper boundary coincided with a decisive break below a well-established ascending channel that had previously guided the asset higher throughout its recent recovery phase.
Market observers note that the current price behavior, characterized by a sluggish sideways-to-downward drift, fits neatly into the classification of a corrective wave, designated as wave (IV) within the broader Elliott Wave framework. Rather than signaling an immediate structural breakdown of the macro bull market, this phase is widely interpreted by technical traders as a natural cooling-off period following an aggressive multi-week rally. During such retracements, market participants frequently monitor historical price action, volume profiles, and key Fibonacci or horizontal support levels to gauge where the correction might ultimately find a stable foundation.
Within this analytical context, several critical price reference zones have been mapped out to monitor Bitcoin’s next directional steps. The primary area of interest for a potential support floor lies between $70,600 and $67,600. This specific pocket aligns closely with a prior horizontal resistance-turned-support level, making it a logical region where buyers might re-enter the market to defend the broader uptrend. If selling momentum accelerates and prices manage to test these lower bounds, market behavior around this zone will likely dictate whether the correction remains shallow or extends further.

On the upside, the ceiling remains firmly defined by the recent high of wave (III) at $87,200, which continues to act as the primary psychological and technical barrier for any immediate bullish continuation attempts. Should the correction successfully conclude within the projected support parameters and buying pressure resume with sufficient volume, analysts point to an upper reference target near $93,600 as the potential destination if a subsequent wave (V) develops to complete the larger impulse sequence.
However, technical frameworks rely heavily on strict invalidation parameters to manage risk and assess shifts in market dynamics. In this scenario, market participants emphasize that a clear and decisive break below the $67,600 threshold would invalidate the current wave count. Should such a breakdown occur, the prevailing market structure would necessitate a comprehensive reassessment, as a violation of this critical floor would suggest deeper structural weakness than a standard corrective consolidation.
While technical illustrations and projected paths—such as the hypothetical yellow trajectory frequently utilized in chart analyses—help visualize potential market scenarios, they remain strictly illustrative rather than predictive. Market conditions in the digital asset sector remain highly dynamic, driven by fluid liquidity conditions, macroeconomic shifts, and evolving trader sentiment. Technical opinions and chart patterns shared across analytical platforms are intended strictly for educational and informational purposes rather than serving as direct financial advice, trading signals, or official recommendations. Traders and investors are routinely encouraged to conduct their own comprehensive market analysis, account for individual risk tolerance, and maintain rigorous risk management strategies before committing capital to any digital asset position.
 Crypto Investing & Trading
 Crypto Investing & Trading
 Crypto Investing & Trading