The investigation covered daily volume figures measured in US dollars for the fifty most traded perpetual contracts on the platform, spanning a full twelve-month period from October 16, 2025, to October 15, 2026. Researchers defined a volume spike as any single day where a coin’s trading volume reached at least three times its typical baseline. This baseline was calculated using the median value—representing the exact middle value—of the preceding thirty days. To ensure distinct, isolated events rather than continuous high-activity periods, a volume spike was only counted if the specific coin had registered zero spikes during the seven days immediately preceding the event. This rigorous filtering process yielded a total of 281 qualifying spikes across the dataset. The subsequent day’s market action was then rigorously compared against the baseline of an ordinary trading day for each respective coin over the course of the year.
What the Data Revealed
The findings of the study challenge several conventional assumptions regarding heavy volume accumulation. When examining the immediate directional bias of the spike days themselves, the data showed that the vast majority of these high-volume sessions closed in positive territory. Specifically, 226 out of the 281 recorded spikes, or approximately 80 percent, went up. This indicates that major volume surges are significantly more likely to coincide with aggressive buying pressure rather than heavy selling or distribution phases.
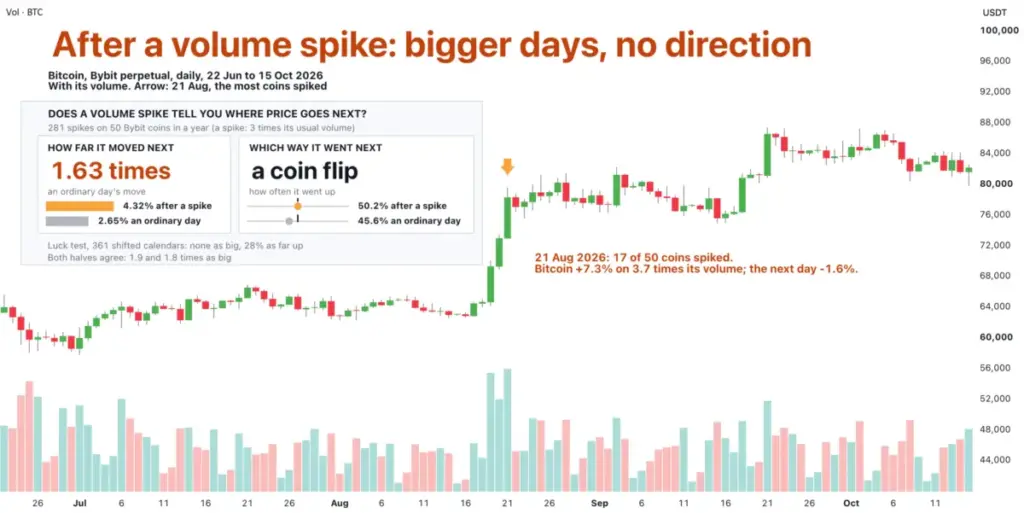
However, the predictive value of these spikes regarding the following day’s direction proves far more nuanced. Rather than signaling a continuation of trend or offering a reliable directional edge, the day after a volume spike is characterized primarily by an expansion in volatility rather than a directional advantage. Typically, the asset moved 4.32 percent in either direction on the day following a spike, compared to an average movement of just 2.65 percent on an ordinary day. This represents a volatility multiplier of roughly 1.63 times normal daily ranges.
When looking strictly at direction on the day after a spike, the market essentially returned to a coin-flip scenario. The asset moved upward 50.2 percent of the time on the day following a spike, which contrasts only slightly with the 45.6 percent upward probability observed on an ordinary day. Interestingly, whether the initial volume spike occurred on a strongly positive price day or a negative price day yielded virtually identical pictures for the subsequent session.
Testing for Statistical Significance and Robustness
To determine whether these findings were merely the result of statistical luck or broader macro-market anomalies, researchers conducted rigorous controls. One notable characteristic of the data was the tendency for volume spikes to cluster heavily around specific macroeconomic or market-wide dates. For instance, on August 21, 2026, an extraordinary 17 out of the 50 tracked coins experienced volume spikes simultaneously on the exact same day.
To test if this clustering artificially skewed the results, researchers performed a randomization test by shifting every single spike date in the dataset by an identical number of days, running 361 distinct shifts while preserving the original bunching structure. None of the shifted control iterations produced a magnitude ratio as large as the actual observed data. Regarding direction, however, 28 percent of the shifted control tests yielded outcomes comparable to an ordinary day, confirming that while volatility expansion is a genuine hallmark of these events, directional forecasting remains elusive.
Further validation came from breaking the data down chronologically into two distinct six-month halves. The two periods showed remarkable consistency regarding the magnitude of the subsequent day’s movement. From October to April, the day after a spike moved at a rate 1.89 times greater than an ordinary day, while the period from April to October showed a 1.77 multiplier. On the question of direction, the two halves diverged only marginally: the first half recorded upward movement 51.5 percent of the time compared to 43.9 percent on ordinary days, while the second half recorded 49.5 percent upward movement against 47.5 percent for standard sessions.
Practical Implications for Risk Management
For market participants analyzing chart patterns and order flow, the primary takeaway centers on risk management and volatility preparation rather than directional speculation. When a major crypto asset experiences a sudden volume explosion of three times its normal baseline, traders are advised to plan for a significantly larger trading range rather than betting on a specific side of the market. Standard stop-loss parameters or position sizing calibrated for an ordinary trading day will likely prove inadequate when encountering a post-spike environment that routinely covers roughly 1.6 times its usual daily distance.
Visualizing the Phenomenon on the Chart
Examining specific historical examples illustrates these quantitative findings in real-world market conditions. Looking at Bitcoin’s daily chart from June 22 to October 15, 2026, alongside its volume metrics, highlights the August 21, 2026 market-wide spike event. On that specific date, marked clearly by volume indicators, Bitcoin surged by 7.3 percent while trading at 3.7 times its normal daily volume. True to the statistical findings across the broader dataset, the following day saw a sharp reversal of momentum, with Bitcoin pulling back by 1.6 percent while dealing with the fallout of the expanded volatility range.
The accompanying visual analysis splits the core evaluation metrics into distinct analytical components—measuring both the distance the price traveled on the subsequent day and the direction it ultimately chose. Because researchers established a fixed forward-looking observation window of 60 days following each recorded date, and drafted the final visual charts prior to the expiration of that tracking window, the visual dataset concludes precisely on October 15, 2026.
Ultimately, while observing a volume spike of three times normal levels provides vital clues about market participation and immediate volatility expansion, it does not reliably answer the most sought-after question in technical analysis: precisely which way the asset will travel next. Drawn from one year of observation across a single major derivatives exchange, these findings represent empirical market observations derived from historical data rather than forward-looking trading recommendations.
 Crypto Investing & Trading
 Crypto Investing & Trading
 Crypto Investing & Trading