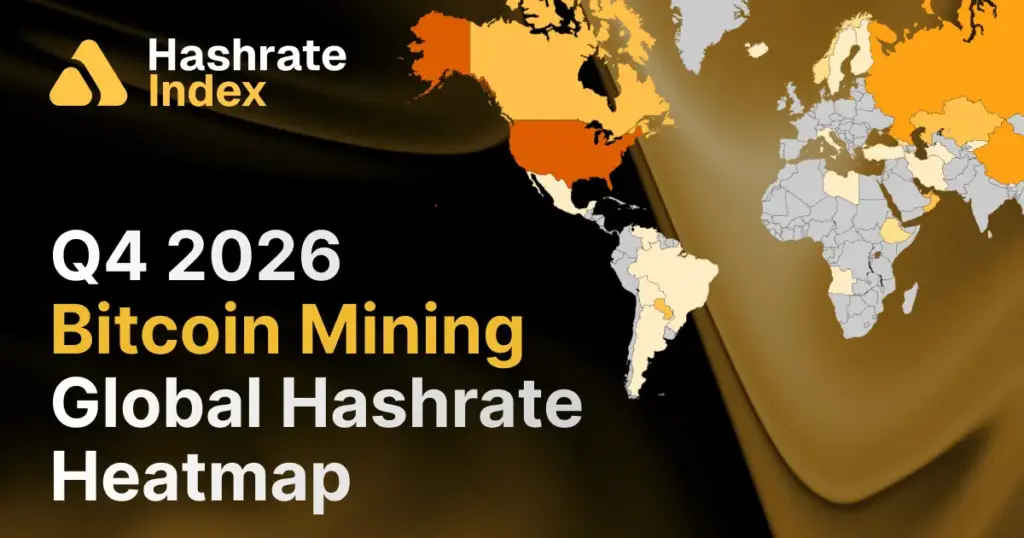
After enduring two consecutive quarters of contraction, the Bitcoin network’s global hashrate has finally halted its downward trajectory. According to the Q4 2026 update of the Hashrate Index Global Hashrate Heatmap, the network’s total compute capacity finished the third quarter at approximately 941 exahashes per second (EH/s), holding virtually flat against the previous quarter’s roughly 940 EH/s.
While a flat headline figure suggests a period of relative calm, a closer examination of country-level metrics reveals an unusually dynamic quarter defined by significant geographic redistribution. During a period when the aggregate network size barely budged, the United States shed another 10 EH/s, Russia expanded by 8 EH/s, Ethiopia abruptly relinquished a third of its total hashrate due to hydroelectric shortages, and Pakistan more than tripled its processing power. The global map of Bitcoin mining is no longer shrinking, but its underlying geographic footprint continues to experience a profound structural evolution.
From Falling to Flat
The stabilization of the 30-day Simple Moving Average (SMA) at ~941 EH/s marks the first time in 2026 that the network’s hashrate has not recorded a quarter-over-quarter decline. However, market observers emphasize that a flat reading is distinct from a true market recovery. The global network remains roughly 8.7% smaller than it was at the same point a year prior, when it stood at approximately 1,031 EH/s in Q4 2025, and sits roughly 15% below its all-time peak reached in November 2025.
The primary driver behind this stabilization is the exhaustion of the industry-wide bleed. Marginal mining machines—those operating on thin margins that were destined to be powered down under prevailing hashprice conditions—have largely been unplugged. Concurrently, mining difficulty has adjusted downward sufficiently to allow the surviving hardware to remain economically viable.
This macro-level equilibrium masked intense localized activity. Five major countries recorded shifts of more than 4 EH/s in either direction, underscoring a continuous relocation of Bitcoin’s physical compute infrastructure across international borders.
Top-Tier Concentration and Shuffling Ranks
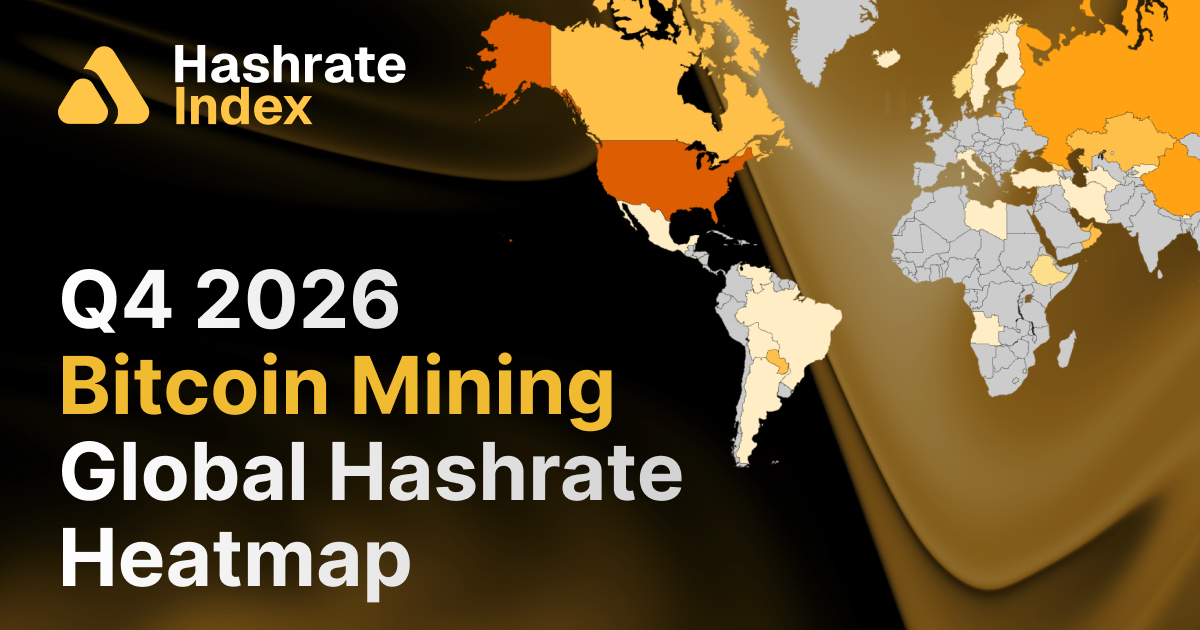
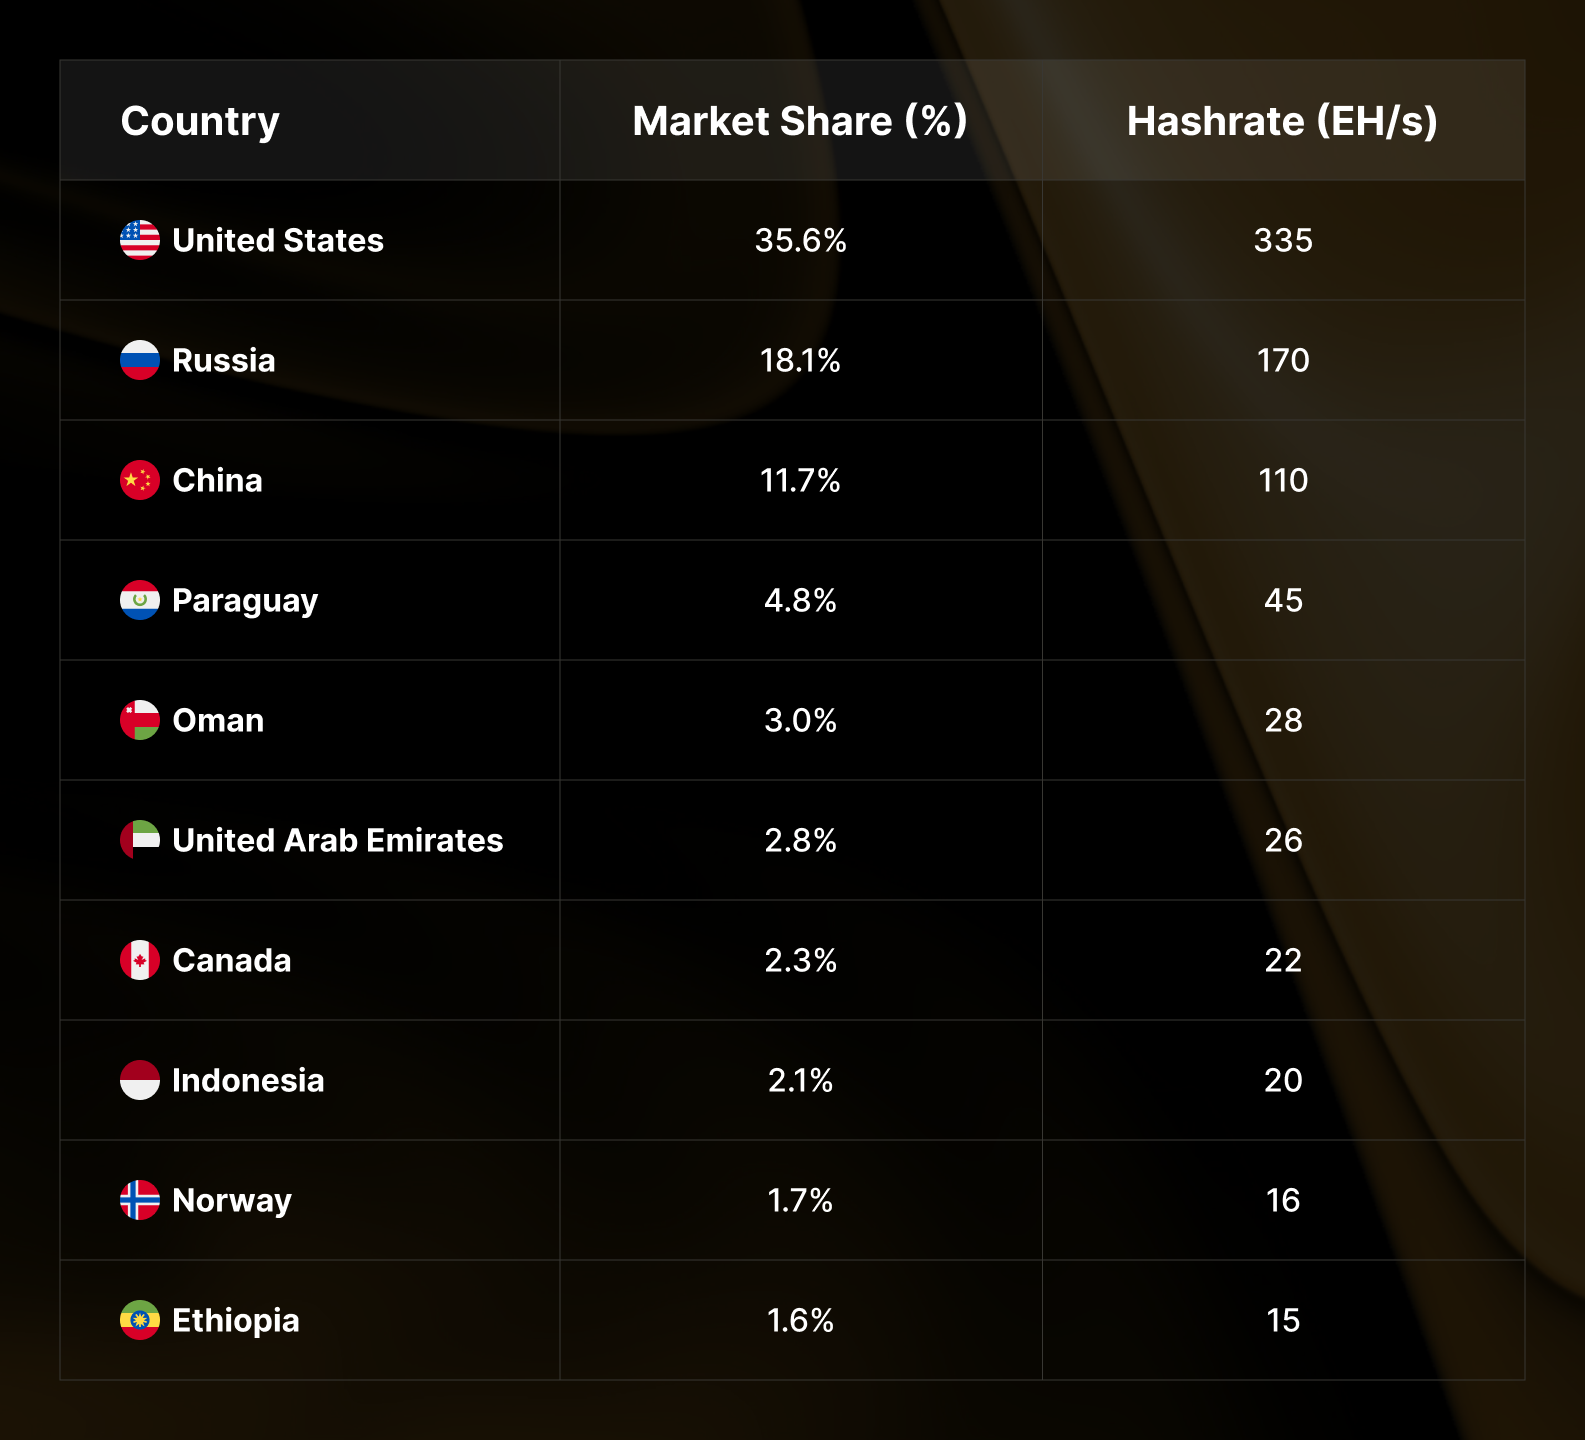
Bitcoin mining continues to exhibit a high degree of geographic concentration, with the top three countries commanding roughly two-thirds of the global hashrate. However, top-three concentration slipped slightly from 66.2% to 65.4%, marking the second consecutive quarterly decline as the United States relinquishes market share faster than other dominant nations can absorb it.
While the identity of the top three nations remained unchanged, five of the ten positions within the global top ten shifted hands during the quarter. Oman climbed past the United Arab Emirates to secure the fifth position. Indonesia advanced from ninth to eighth on the back of a genuine 3 EH/s gain, while Ethiopia dropped precipitously from eighth to tenth. Meanwhile, Kazakhstan held steady at the eleventh spot with approximately 15 EH/s for the second consecutive quarter, placing it in a virtual dead heat with Ethiopia for the final top-ten slot heading into the new year.
The Divergence Between Developed Cores and Frontier Markets
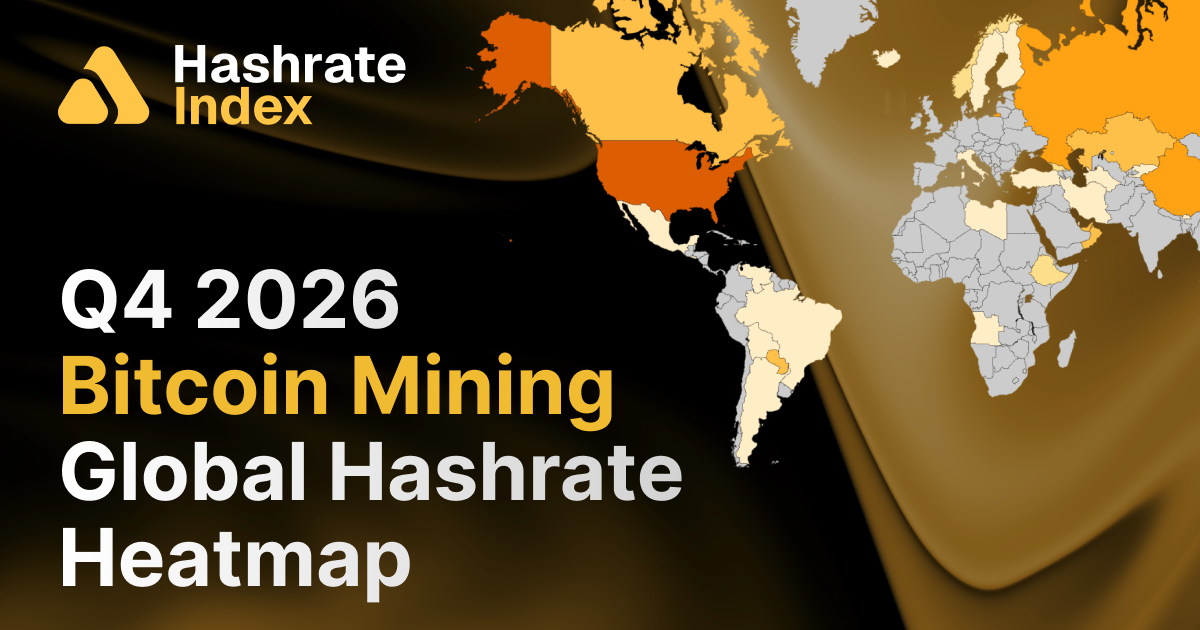
A geographic comparison between Q4 and Q3 2026 highlights a clear structural split: traditional developed mining hubs are contracting, while emerging frontier markets are rapidly expanding.
Among the notable decliners, the United States and Canada continued their downward trends. Conversely, the market saw substantial growth in unexpected regions. Pakistan added approximately 5.5 EH/s to reach 8 EH/s, marking the largest absolute expansion in its history. Similarly, Venezuela grew by 4 EH/s, pushing its total capacity into double digits at approximately 10 EH/s—a figure that places it ahead of established mid-tier markets like Laos, Finland, and Malaysia.
When examining the broader year-over-year perspective, the long-term trends become even clearer. Every market that registered consistent annual growth represents a low-cost or stranded-power jurisdiction. Paraguay, for instance, anchored its down-cycle growth by adding another 1 EH/s to reach approximately 45 EH/s, securing the fourth spot globally through the utilization of Itaipú hydropower. Indonesia similarly solidified its status as a structural gainer, climbing to roughly 20 EH/s with an 18% year-over-year increase driven by Southeast Asian hydro diversification.
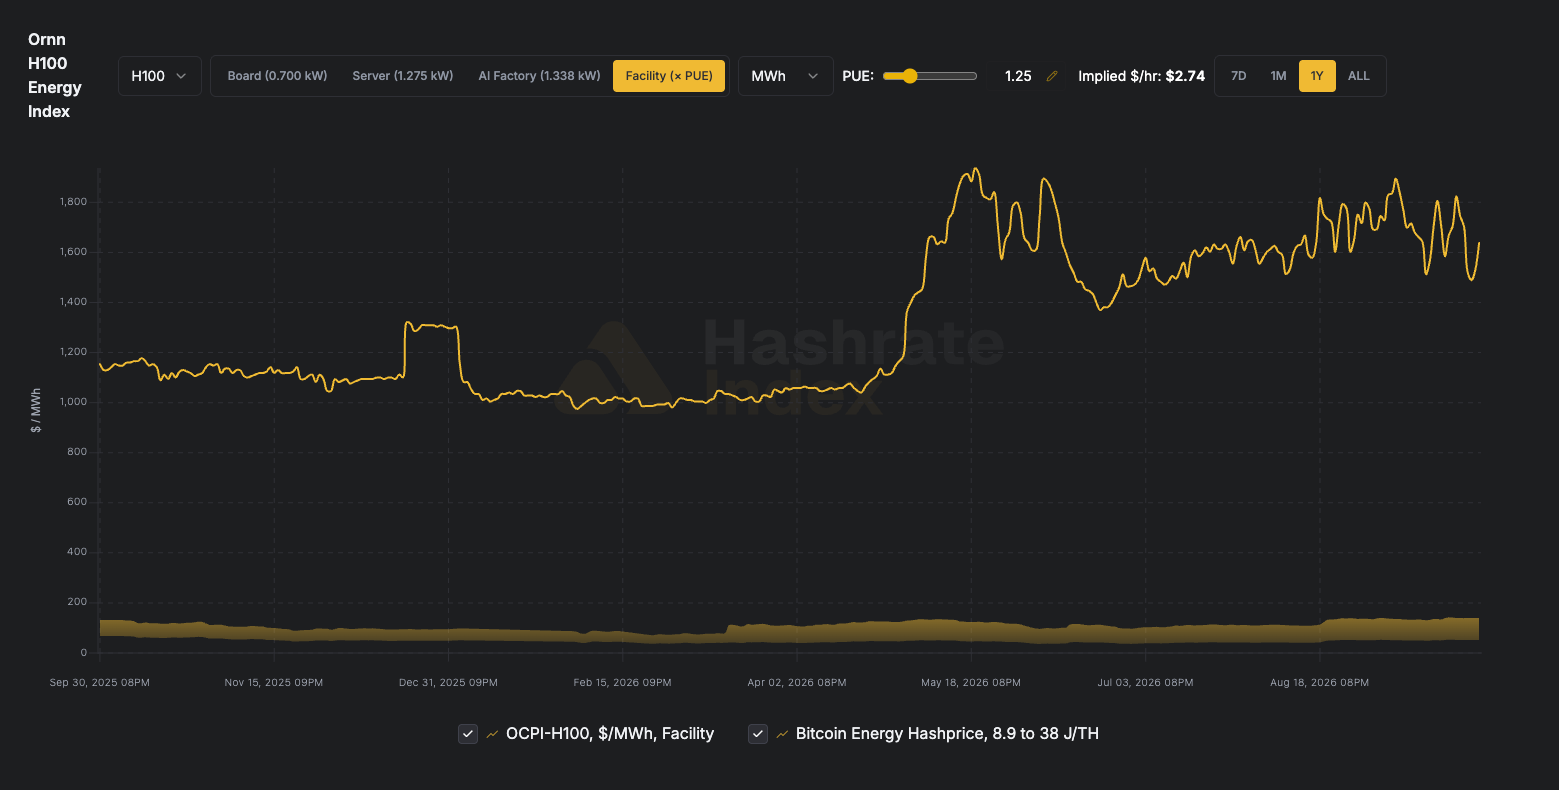
In contrast, the shrinking markets in the developed world cannot be attributed to a sudden lack of competitive power pricing. Jurisdictions like Canada and the United Arab Emirates host abundant, low-cost energy supplies, ranging from Quebec’s robust hydro networks to Abu Dhabi’s gas, solar, and nuclear portfolios. Instead, these markets are losing hashrate because local operators are pivoting their energy infrastructure toward Artificial Intelligence and High-Performance Computing (AI/HPC).
The economic incentive driving this shift is substantial. While Bitcoin mining yields competitive returns depending on hashprice, AI compute infrastructure generates significantly higher revenue per megawatt-hour. Once energy capacity is committed to multi-year AI tenants under long-term leases, it cannot easily be returned to Bitcoin mining, even if cryptocurrency prices rally and network difficulty declines. Consequently, the contraction of hashrate in countries like the United States and Canada represents a permanent reallocation of energy resources rather than a temporary shutdown of mining rigs.
Ethiopia’s Hydroelectric Setback
One of the most dramatic developments of the quarter was the sudden reversal in Ethiopia, which saw its hashrate plummet from approximately 23 EH/s down to 15 EH/s. This 35% quarterly drop pushed the country from the eighth position down to tenth, erasing its gains and returning it to mid-2025 operational levels. Measured from its peak of roughly 27.5 EH/s in Q1 2026, the Ethiopian market has contracted by 45% over three quarters.
The contraction was not driven by regulatory crackdowns or policy reversals, but rather by severe environmental constraints. On September 15, Ethiopian Electric Power enacted sweeping supply curtailments, reducing electricity allocations to Bitcoin miners to roughly 23% of contracted volumes—a reduction of approximately 75%. The cuts were implemented after reservoir inflows dropped by roughly 20% due to El Niño-driven dry conditions.
Because Ethiopia’s mining sector is heavily concentrated and reliant on large-scale hydro generation from facilities like the Grand Ethiopian Renaissance Dam, the sector proved exceptionally vulnerable to hydrological deficits. Industry observers note that Ethiopian hashrate is likely to remain constrained or fall further unless upcoming seasonal water inflows show a marked recovery.
The Reacceleration of Frontier Jurisdictions
While traditional and hydro-dependent markets faced headwinds, frontier mining jurisdictions stepped in to absorb displaced hardware. Pakistan’s expansion from 2.5 EH/s to 8 EH/s represents a fundamental step change rather than a temporary rebound, positioning the country level with Bhutan and ahead of several European and Asian jurisdictions.
In Latin America, Venezuela crossed the 10 EH/s threshold, recording a 122% year-over-year increase despite operating under a formal government prohibition on cryptocurrency mining that has remained in force since mid-2024. Geolocated network traffic and regional reporting indicate that the surviving operations function primarily through informal or semi-legitimate channels. Meanwhile, Iran recorded a modest uptick, moving from 2 EH/s to 3 EH/s in its first quarterly increase since diplomatic and geopolitical tensions escalated with the United States earlier in the year.
Regional Dynamics Across the Globe
Examining the global landscape on a regional basis highlights distinct local trajectories. In North America, the United States remains the dominant global player with a 35.6% market share, though its output declined to roughly 335 EH/s, down 14% year-over-year from its peak of 400 EH/s in Q1 2026. Canada experienced a continuation of its downward trend, sliding to 22 EH/s.
Across Europe and Central Asia, Russia emerged as the quarter’s largest absolute gainer, adding 8 EH/s to reach 170 EH/s, which translates to an 18.1% global market share. Kazakhstan stabilized at 15 EH/s following a prolonged period of contraction, while Norway and Georgia held steady at 16 EH/s and 11 EH/s, respectively.
In the Asia-Pacific region, China’s hashrate continued its gradual multi-quarter bleed, easing to approximately 110 EH/s. Conversely, Southeast Asian nations like Indonesia and Malaysia continued to absorb regional mining capacity, while Laos expanded to 9 EH/s.
Within the Middle East, Oman added 2 EH/s to reach 28 EH/s, successfully surpassing the UAE, which contracted to 26 EH/s. Latin America saw continued strength in Paraguay alongside Bolivia’s modest growth to 4 EH/s, even as Argentina faced ongoing macroeconomic instability that weighed on its domestic mining sector. Finally, Africa’s mining landscape was dominated by Ethiopia’s steep contraction, leaving the continent’s flagship market searching for stability as winter conditions set in.
 Cryptocurrency Mining
 Cryptocurrency Mining
 Cryptocurrency Mining