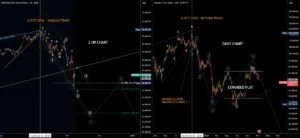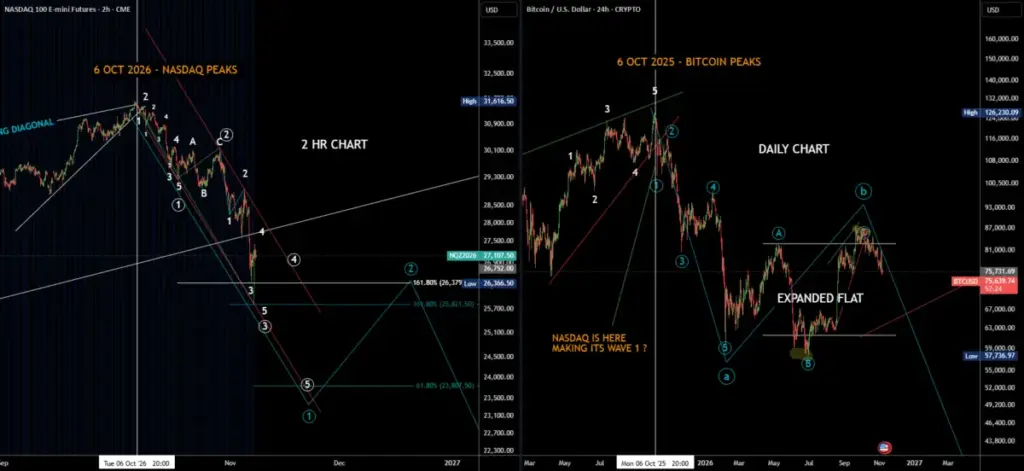
Market observers are closely monitoring a fascinating temporal alignment between the world’s leading cryptocurrency and traditional equities, as technical analysis suggests Bitcoin may have peaked precisely one year ahead of the Nasdaq index. This
striking correlation has sparked intense discussion among technical analysts regarding the broader macroeconomic cycle, investor sentiment, and the intricate wave structures currently governing both risk-on asset classes.
The observation, which highlights a precise 365-day lead time in Bitcoin’s top relative to the tech-heavy Nasdaq, has opened the door to advanced Elliott Wave interpretations for both markets. Analysts attempting to decode the current market structure suggest that the Nasdaq may currently be navigating the preliminary stages of a larger corrective phase, specifically pointing toward Wave 1 of Downwave A. Within this broader downward trajectory, market technicians are observing finer nuances, indicating that equities might currently be experiencing Subwave 4 up as part of a larger Primary Wave 3 down, all contained within the initial downward wave sequence.
Recent market activity, particularly observed shifts in volatility indices such as the Cboe Volatility Index (VIX) moving downward toward the end of the trading week, has added credence to these short-term cyclical hypotheses. Technical interpreters note that with Friday’s downward movement in the VIX, Subwave 4 could be nearing its definitive conclusion, which would potentially clear the path for the next leg of the broader downward sequence in equities.
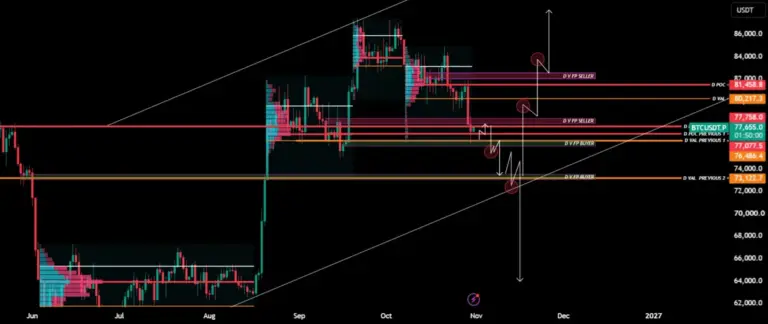
At the same time, the cryptocurrency market is exhibiting its own complex technical patterns. Bitcoin appears to have constructed what technical analysts classify as an expanded flat pattern for its B wave, a development that suggests the digital asset may now be standing at the very precipice of Downwave C. In technical analysis, the expanded flat is widely recognized as a particularly treacherous and psychologically punishing formation for market participants because it characteristically features a series of consecutive bear and bull traps designed to shake out leveraged and emotional traders alike.
This deceptive pattern typically unfolds in a sequence that first sweeps the absolute lows of Downwave 5 before staging a sharp reversal to sweep the previous highs of Wave A within the broader ABC correction framework. Such price action frequently induces false confidence among bulls during the intermediate peaks and deep despair among bears during the intermediate troughs, making navigation exceptionally difficult for short-term traders relying on traditional momentum indicators.
As these multi-market wave patterns continue to develop, analysts emphasize that technical formations of this complexity require heightened vigilance rather than hasty execution. The striking symmetry between Bitcoin’s historical cycle peak and the subsequent behavior of the Nasdaq serves as a reminder of the interconnected nature of modern global liquidity and risk sentiment, even as digital assets and traditional equities maintain distinct internal market mechanics and regulatory environments.
Disclaimer
The information and publications provided in market analysis reports and trading community discussions are not meant to be, and do not constitute, financial, investment, trading, or other types of advice or recommendations supplied or endorsed by TradingView or affiliated financial reporting entities. Readers and market participants are strongly encouraged to review the full terms of use and policies regarding investment decisions and trading before acting on any technical interpretations or market outlooks discussed in financial commentaries.
 Crypto Investing & Trading
 Crypto Investing & Trading
 Crypto Investing & Trading