Bitcoin is once again exhibiting capital-flow patterns that closely mirror the formative stages of its previous historical bull markets, according to an assessment shared by Ki Young Ju, the founder and chief executive officer of prominent blockchain analytics firm Cryptoquant. This optimistic on-chain outlook arrives in tandem with surging institutional interest through traditional financial corridors, highlighted by a staggering $1.07 billion in cumulative net inflows directed into U.S. spot bitcoin exchange-traded funds over a robust three-session stretch concluding on October 21. Together, these on-chain metrics and macroeconomic fund flows paint a comprehensive picture of renewed, high-conviction demand across the broader digital asset ecosystem.
Fresh Capital Points to Bull Market Conditions
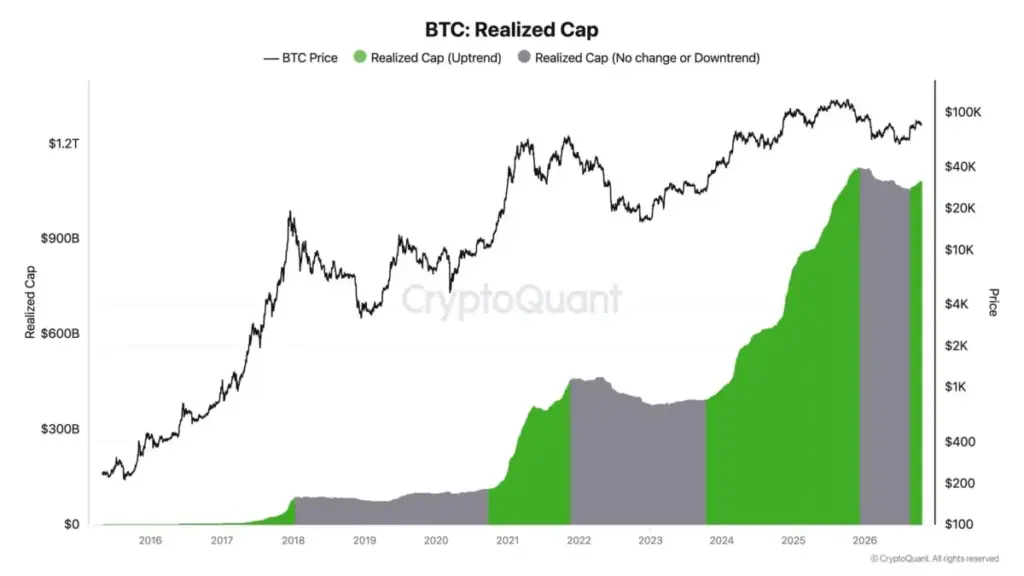
The conversation surrounding market structure intensified on October 21 when Cryptoquant CEO Ki Young Ju took to the social media platform X to present a detailed realized-capitalization chart. This analytical framework contrasts long-term valuation metrics directly against bitcoin’s historical price action across multiple market cycles, offering a window into how capital enters and leaves the asset class over extended periods.
In his commentary accompanying the data visualization, Ju offered a succinct yet powerful observation regarding the current state of liquidity, stating that fresh capital is actively flowing into bitcoin, a phenomenon that historically materializes exclusively during established bull markets.
The proprietary chart shared by the analytics executive utilizes color-coded intervals to distinguish market phases. Periods characterized by a rising realized capitalization are highlighted in vibrant green, while intervals where the metric remains flat or experiences a relative decline are marked in gray. Looking back at historical cycles, earlier green stretches align cleanly with major macroeconomic expansions, including the retail-driven rally of 2017, the institutional and pandemic-era liquidity boom of 2020 through 2021, and the subsequent upward trajectory extending into 2025. The most recent segment of the chart has similarly shifted into a pronounced green phase, providing strong visual and quantitative backing for Ju’s interpretation that a fresh wave of capital has decisively entered the ecosystem.
How Bitcoin’s Capital Signal Is Calculated
To fully appreciate the significance of Ju’s assessment, it is necessary to examine the underlying mechanics of realized capitalization and how it diverges from traditional market capitalization. Standard market capitalization is calculated by multiplying the total circulating supply of bitcoin by its current spot price, making it a volatile metric that fluctuates rapidly alongside minute-to-minute market sentiment.

In contrast, realized capitalization offers a more nuanced measure of aggregate market value by valuing each individual coin at the exact price it commanded when it last moved on the blockchain. This effectively establishes a cumulative cost basis for the entire network, filtering out the noise of short-term speculative price swings and capturing the actual economic value locked into the asset.
Every time a bitcoin transaction occurs on the network, it spends existing unspent transaction outputs and creates new ones, thereby resetting the valuation timestamp for the transferred coins in the blockchain’s permanent ledger. As these transaction inputs and outputs shift over time, the coins involved acquire updated valuations within the realized-cap framework. While an increasing realized capitalization is universally interpreted by on-chain analysts as a sign of fresh investment and organic capital influx, market observers also account for internal variables, such as capital transfers between a single holder’s self-custody wallets, which can occasionally influence the aggregate reading.
This capital-flow analysis complements other structural valuation tools used to gauge market health, including metrics focused on aggregate holder profitability. Previous framework analyses released by Cryptoquant in July utilized distinct profitability-based cycle indicators to assess valuation ratios and investor realized gains, pointing toward the possibility that the ultimate peak of the current market cycle may still lie ahead. By combining realized capitalization with holder profitability metrics, analysts gain a multifaceted view of market dynamics that extends well beyond surface-level price action.
ETF Flows Add Context to Bitcoin’s Bull Market Signal
While on-chain metrics provide deep insight into blockchain-level activity, the institutional landscape offers an equally compelling narrative of renewed demand. U.S. spot bitcoin exchange-traded funds experienced a massive resurgence of institutional participation, attracting approximately $524.8 million in net inflows on October 21 alone. This single-day surge extended an impressive inflow streak to three consecutive trading sessions, bringing the cumulative three-day total for the specialized investment vehicles to roughly $1.07 billion.
The institutional capital was distributed across several major issuers, reflecting broad-based participation rather than isolated interest in a single product. BlackRock’s iShares Bitcoin Trust (IBIT) dominated the day’s additions, pulling in $235 million, closely followed by Fidelity’s Wise Origin Bitcoin Fund (FBTC), which attracted $212.7 million. Grayscale’s converted Bitcoin Trust (GBTC) saw continued stabilization and positive momentum with $32.6 million in inflows, while Bitwise’s BITB added another $19.2 million to the day’s tally.
Despite this monumental influx of institutional capital and the bullish on-chain signals highlighted by Cryptoquant, the broader market experienced typical bouts of short-term volatility. Bitcoin was observed trading near the $81,000 threshold on October 22, having undergone a natural retracement from an intraday high of approximately $84,739 recorded the previous day. That high-water mark had briefly triggered a wave of liquidations across derivatives markets, wiping out approximately $188 million in short positions before prices consolidated. Trading activity remained robust across the global marketplace, with approximately $35.5 billion worth of bitcoin changing hands over the preceding 24 hours as market participants digested the convergence of strong ETF demand and historical on-chain bull market indicators.
 Bitcoin & Major Altcoins
 Bitcoin & Major Altcoins
 Bitcoin & Major Altcoins