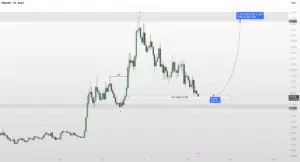
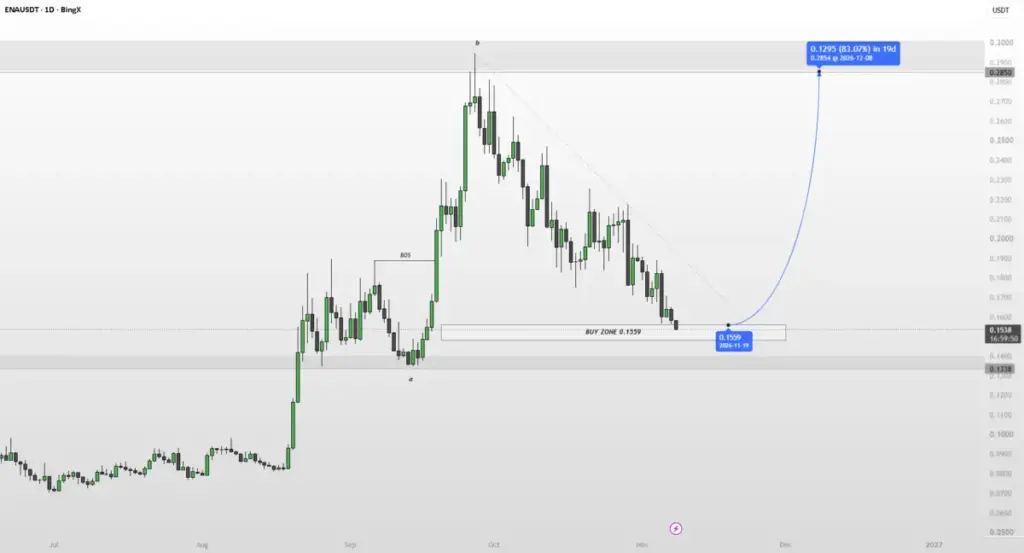
The digital asset ENA is currently drawing significant attention from market observers as it approaches a crucial technical milestone. Price action on the charts indicates that the token is sliding toward its 88.6% Fibonacci retracement level, converging neatly around the $0.1559 mark. This specific price region has been marked by analysts as a key buy zone, setting the stage for what could be a pivotal moment for the cryptocurrency’s near-term market trajectory.
Despite this upcoming test of support, the overarching market structure for ENA remains predominantly bearish. The token has continued to print a succession of lower highs and lower lows across the broader timeframes. This downward momentum has been persistent ever since the asset suffered a strong rejection at the $0.1559 resistance-turned-ceiling, specifically following a failed attempt to sustain upward momentum above the $0.2850 threshold. That prior rejection effectively established the current bearish channel, within which ENA has steadily drifted lower over recent weeks.
Market participants are now closely monitoring how the asset will behave as it tests the boundaries of this designated buy zone. Analysts are looking for a definitive, observable reaction around the $0.1559 area. In technical analysis, approaching deep retracement levels of major moves often triggers algorithmic buying or short-covering, which can allow an asset to establish a temporary local low. If buying pressure materializes at this juncture, it could provide the necessary catalyst for ENA to attempt a short-term bullish reversal.
Should the buy zone successfully absorb the current selling pressure and inspire a durable bounce, market analysts suggest that the door could open for a recovery rally. Such a bullish extension would likely target a return toward the $0.2850 region, representing the previous high established before the onset of the current bearish leg. Reaching that objective would require a substantial shift in momentum and a break of the existing lower-high market structure, but a reaction at the 88.6% Fibonacci level is viewed by technical traders as the necessary first step for any sustained relief rally.
However, the bearish pressures currently dominating the broader chart cannot be ignored, and risk management remains a focal point for market participants tracking the setup. If the identified buy zone fails to hold against incoming selling volume, the technical outlook suggests that ENA could experience accelerated downside. In the event of a sustained breakdown beneath the $0.1559 support region, the next major historical support level sits significantly lower, resting around the $0.1338 mark. A failure to defend the current zone would likely invalidate the immediate reversal thesis and invite further downward consolidation within the established bearish trend.
Disclaimer
The information and publications are not meant to be, and do not constitute, financial, investment, trading, or other types of advice or recommendations supplied or endorsed by TradingView. Read more in the Terms of Use.
 Crypto Investing & Trading
 Crypto Investing & Trading
 Crypto Investing & Trading