Ethereum (ETH) has once again retreated to the crucial lows associated with wave 4, sparking renewed interest and positioning among technical traders monitoring the digital asset’s medium-term trajectory. As the second-largest cryptocurrency by market capitalization navigates this critical juncture on the charts, market participants are closely evaluating price action, liquidity sweeps, and potential reversal signals to determine whether the broader bullish structure remains intact.
The Bigger Picture
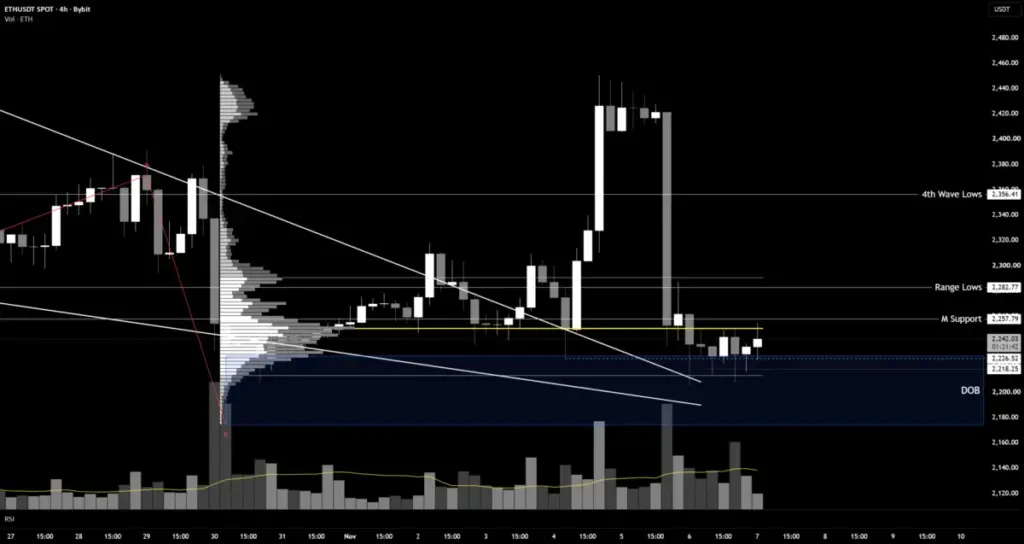
From a broader Elliott Wave perspective, the current technical read suggests that Ethereum is hovering at the foundational lows of wave 4. Within this market structure, the recent formation of a double bounce may be signaling the establishment of a higher low—a critical technical development defined by a price trough sitting comfortably above the preceding low.
In the experience of seasoned market participants, the final phases of a wave 4 correction are frequently characterized by this exact type of double-bounce pattern. Such price action routinely serves to flush out over-leveraged long positions from the market, creating the necessary conditions for a subsequent upward impulsive move. When traders who borrowed capital to fund their long positions are forced into liquidation or voluntary selling, the resulting clearance of stagnant liquidity often paves the way for a more sustainable trend continuation. However, analysts emphasize that this reading remains a probabilistic market interpretation rather than a guaranteed outcome.
What the Chart Shows
A closer examination of the lower-timeframe and mid-timeframe charts reveals a sequence of decisive technical movements. Price action recently broke out of a falling wedge formation, triggering a sharp relief rally before giving back the entirety of those gains in a single, sizable four-hour candle. This aggressive retracement sliced directly through the established range lows at 2,282.77 and breached the monthly support level situated at 2,257.79.
Presently, Ethereum is trading directly at the upper boundary of the daily order block—a recognized zone of historical demand where institutional and retail buyers have previously stepped in to absorb selling pressure. Notably, price has probed below the November 4 swing low of 2,226.52 on multiple occasions without sustaining downward momentum beneath that threshold. In technical analysis, this behavior is classified as a liquidity sweep, wherein the market briefly trades past an earlier swing low to trigger resting stop-loss orders from late longs, subsequently reversing course as buyers regain control.
The Plan: If This, Then That
Navigating such volatile market conditions requires a structured, conditional framework rather than emotional decision-making. Traders operating within this environment are evaluating several distinct scenarios based on how daily and four-hour candles close relative to key technical barriers.
If a four-hour price candle successfully closes back above the monthly support level at 2,257.79 and subsequently reclaims the range lows at 2,282.77, it would indicate that the recent double bounce has successfully held. Under this scenario, market expectations point toward a measured recovery aiming to retest the wave 4 lows at 2,356.41 as an interim milestone on the path toward higher upside targets.
Conversely, if price action continues to probe beneath the 2,226.52 threshold without managing to secure a decisive four-hour close back above the monthly support level, it signals that the corrective wave 4 structure is still actively developing, necessitating patience and restraint from market participants. A more drastic invalidation level is set further down; should Ethereum trade below the 1,800 psychological and technical marker, the foundational thesis underpinning the current long trade would be rendered fundamentally incorrect.
Where It Could Go
Looking well beyond the immediate market noise, the broader macro projection for the completion of this multi-month corrective cycle targets a significant upside level at 3,844. Given the considerable distance between current market valuations and this ambitious target, analysts anticipate that achieving such a price objective will likely require an extended timeframe spanning several weeks to months rather than days, reflecting the natural consolidation and accumulation phases typical of major crypto market cycles.
What I’m Doing
In alignment with this technical outlook, current live positioning involves an active long trade on Ethereum, with the intention of maintaining the position until it either reaches the 3,844 target or triggers the strict invalidation parameter below the 1,800 mark. Observers note that this specific trade setup deviates from conventional strict pullback rules, as it lacks a newly established break of market structure emerging directly out of the recent local low.
As always, market assessments of this nature represent individual chart interpretations rather than formal financial advice. Given that a trade held across a multi-month horizon is inherently exposed to significant drawdown potential before achieving profitability, risk management and position sizing remain paramount to ensure that potential losses resulting from an incorrect market thesis remain manageable.
Disclaimer
The information and publications provided in this report are not meant to be, and do not constitute, financial, investment, trading, or other types of advice or recommendations supplied or endorsed by TradingView or related market platforms.
 Crypto Investing & Trading
 Crypto Investing & Trading
 Crypto Investing & Trading