After enduring two consecutive quarters of contraction, the Bitcoin network’s hashrate has finally halted its downward trajectory. According to the Q4 2026 update of Hashrate Index’s Global Hashrate Heatmap, the global hashrate finished the third quarter at approximately 941 EH/s, remaining effectively flat compared to the ~940 EH/s recorded in Q2.
While the headline figure appears steady, a closer look beneath the surface reveals an unusually dynamic quarter characterized by significant geographical redistribution. The United States shed another 10 EH/s, while Russia posted an 8 EH/s increase. At the same time, Ethiopia surrendered roughly a third of its compute power due to severe hydroelectric constraints, whereas Pakistan experienced a surge that more than tripled its capacity.
The global mining map is no longer shrinking overall, but compute power continues to migrate aggressively across international borders in search of optimal economic and operational conditions.
From Falling to Flat
Following two successive quarters of decline, the network hashrate for Q3 2026 arrived at a standstill. The 30-day simple moving average registered approximately 941 EH/s against the previous quarter’s 940 EH/s, marking the first time in 2026 that the metric did not drop.
However, stabilization does not equate to a full market recovery. The network remains roughly 8.7 percent smaller than it was at this time last year, when it stood at approximately 1,031 EH/s in Q4 2025, and sits roughly 15 percent below its all-time peak recorded in November 2025.
The primary change this quarter is the slowing rate of the bleed. Marginal mining machines that were destined to switch off under prevailing hashprice conditions have largely already been decommissioned. Meanwhile, mining difficulty has adjusted downward sufficiently to keep surviving operators above water.
This environment has left the most compelling activity happening at the country level. Five different nations experienced shifts of more than 4 EH/s in either direction. In a quarter where total global compute barely budged, this represents pure geographical redistribution as Bitcoin’s infrastructure relocates to new jurisdictions.
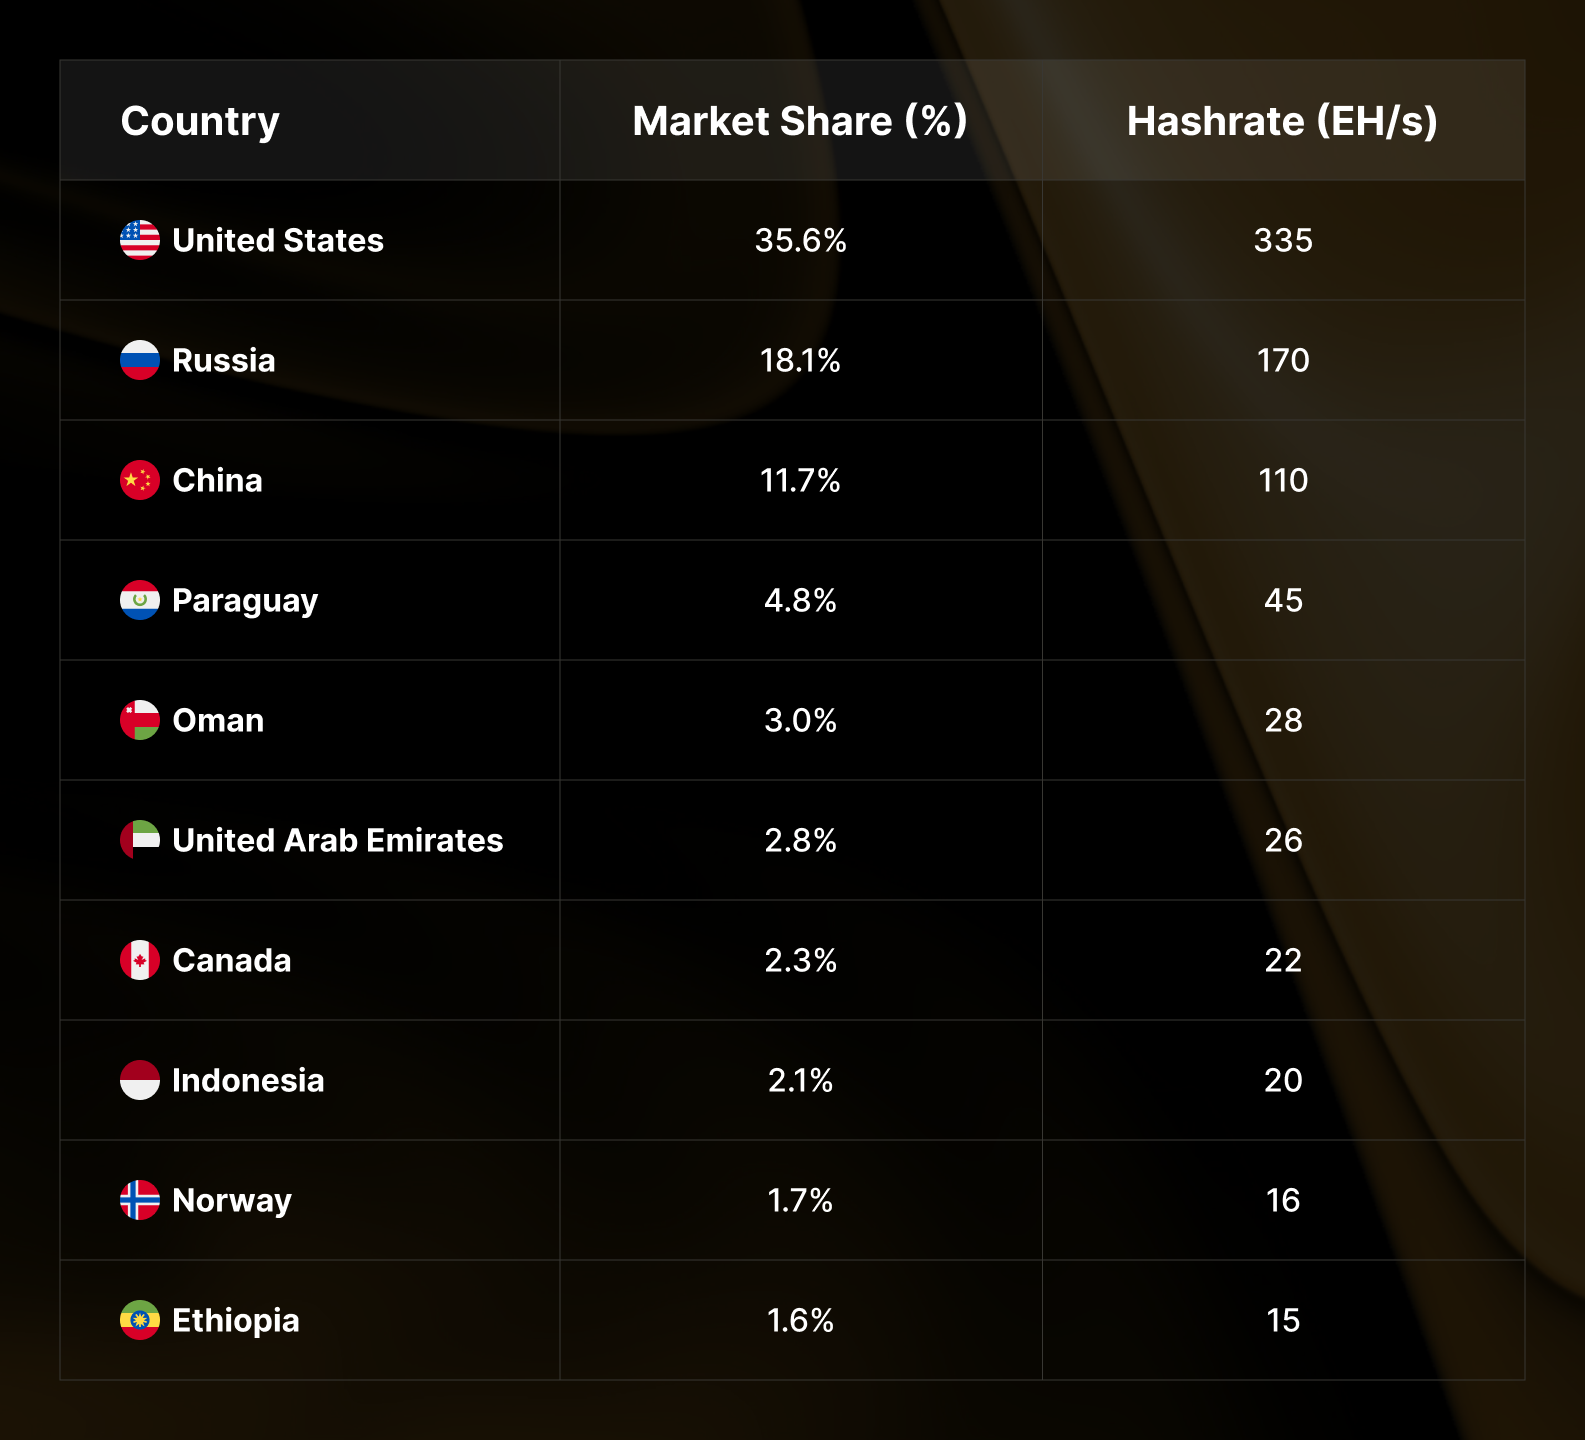
Bitcoin mining remains a highly concentrated industry, with the top three countries commanding roughly two-thirds of the global hashrate. While the identity of the top three nations remains unchanged, five of the ten overall rankings shifted hands during the quarter. Oman climbed past the United Arab Emirates to secure the fifth position, while Indonesia advanced from ninth to eighth on the back of a genuine 3 EH/s gain. Conversely, Ethiopia slipped from eighth down to tenth place. Kazakhstan held steady at the eleventh spot with roughly 15 EH/s for the second consecutive quarter, placing it in a virtual tie with Ethiopia for the final top-ten slot heading into the new year.
Overall, concentration among the top three countries slipped slightly from 66.2 percent to 65.4 percent, marking the second consecutive quarterly drop. Data indicates that the United States is relinquishing market share faster than Russia is absorbing it.
Quarter-over-Quarter Movers
Comparing Q4 2026 to Q3 2026 highlights a clear structural split across the global map: a shrinking developed core contrasted against a rapidly expanding frontier.
The notable decliners in terms of absolute hashrate losses were concentrated in established markets, led by the ongoing contraction in the United States and the sharp drop in Ethiopia. On the other side of the ledger, the gainers were driven by developing markets and stranded-energy hubs. Pakistan added a notable 5.5 EH/s—representing a larger absolute expansion than any previous period for the country—while Venezuela grew by 4 EH/s to establish itself as a roughly 10 EH/s market, surpassing countries like Laos, Finland, and Malaysia.
Unlike minor fluctuations seen in previous quarters, these emerging market additions represent substantial capacity expansions rather than statistical rounding errors.
Year-over-Year Perspective: The Long View
Examining twelve-month trends helps filter out quarterly noise to reveal more durable structural trajectories. Across the board, every market that achieved annual growth represents a low-cost or stranded-power narrative.
However, the declining markets do not form a simple mirror image of that trend. Jurisdictions like Canada and the United Arab Emirates are not prohibitively expensive places to operate mining facilities. Canadian hashrate relies heavily on hydroelectric resources in Quebec, Manitoba, and British Columbia, while Abu Dhabi draws on a mix of natural gas, solar, and nuclear energy supplies.
These markets did not lose hashrate because local power became unaffordable. Instead, they lost compute capacity because the available energy found a more lucrative application. Both regions host sophisticated operators well-positioned to participate in the artificial intelligence and high-performance computing pivot that dominated the technology landscape throughout 2026.
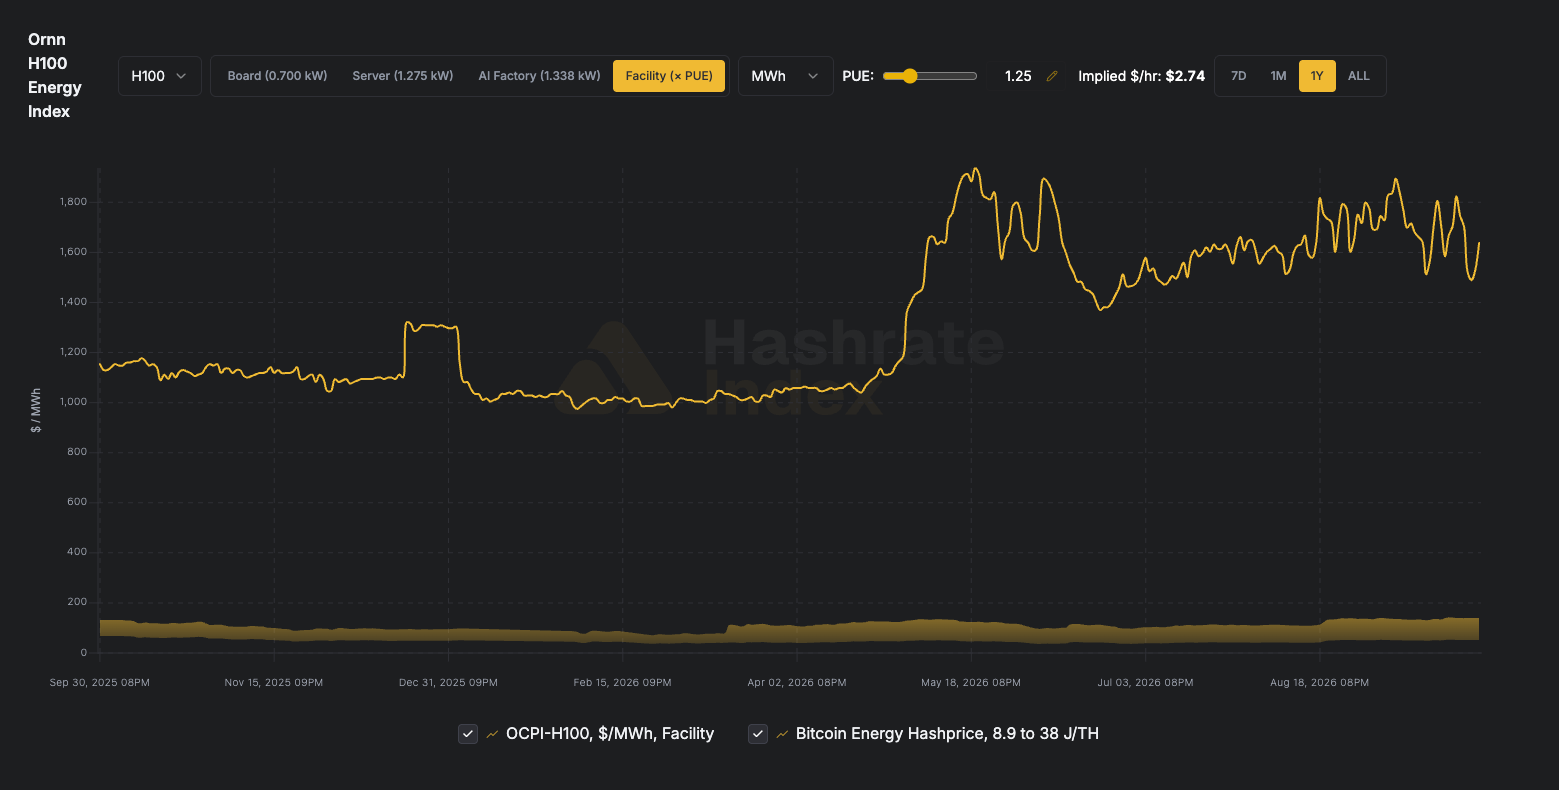
The economic realities of this shift are stark: AI compute generates anywhere from $1,500 to $3,500 per megawatt-hour, compared to a range of $50 to $150 for traditional Bitcoin mining. This distinction carries significant implications for the future of the network. A marginal mining machine that shuts down because hashprice drops can eventually be powered back on if conditions improve. Conversely, power infrastructure committed to a multi-year AI tenant cannot be easily reclaimed, even if the price of Bitcoin rallies and mining difficulty declines.
Consequently, global decliners are splitting into three distinct categories: capacity converting to AI and high-performance computing, such as the United States, Canada, and the UAE; regulatory and geopolitical pressures, seen in Kazakhstan, China, and Iran; and macroeconomic instability, as observed in Argentina. Ethiopia, which faces a unique resource constraint rather than a regulatory or AI-driven pivot, represents an entirely separate case.
Standouts and the Ethiopian Energy Squeeze
Paraguay continues to anchor the cohort of nations growing through the current down-cycle, adding another 1 EH/s to reach approximately 45 EH/s, good for fourth globally and a 12 percent year-over-year increase anchored by Itaipu hydropower. Indonesia stands out as the quarter’s clearest structural gainer, operating at around 20 EH/s to secure a top-eight slot with an 18 percent annual growth rate, driven by Southeast Asian hydro diversification. Meanwhile, Norway maintained a steady 16 EH/s for four consecutive quarters, though flat performance in a stabilizing network no longer accrues market share the way it did previously.
The most dramatic reversal of the quarter belongs to Ethiopia, which saw its hashrate fall from roughly 23 EH/s down to 15 EH/s. This 35 percent quarterly drop pushes the country from eighth to tenth place, returning its compute capacity to mid-2025 levels. Measured from its peak of 27.5 EH/s in the first quarter of 2026, the market has contracted by 45 percent over three quarters due to a severe resource shortage rather than policy shifts.
On September 15, Ethiopian Electric Power drastically reduced electricity supplies to Bitcoin miners to roughly 23 percent of their contracted volume—a reduction of approximately 75 percent. The cuts were implemented after regional reservoir inflows dropped by about 20 percent amid El Niño-driven dry conditions.
Ethiopia proved unusually vulnerable to this shortfall because its entire mining industry is heavily dependent on a single hydro asset, the Grand Ethiopian Renaissance Dam, and because local miners hold interruptible power agreements that legally allow the utility to curtail supply during domestic shortages. Without a recovery in reservoir inflows, Ethiopian hashrate is widely expected to face further declines.
Regional Dynamics and Frontier Growth
While established mining hubs contract or stabilize, frontier markets are reaccelerating. Pakistan and Venezuela combined to add roughly 9.5 EH/s during the quarter, nearly offsetting the entire contraction recorded in the United States.
Pakistan expanded from 2.5 EH/s to approximately 8 EH/s, surpassing previous domestic peaks and placing it ahead of Finland and Malaysia, though still trailing Laos at roughly 9 EH/s. Venezuela crossed into double digits at approximately 10 EH/s, marking a 122 percent year-over-year increase. This growth occurred despite a formal state prohibition on cryptocurrency mining that has remained in force since mid-2024, with field data indicating that surviving operations are largely informal or semi-legitimate. Iran also ticked upward for the first time since regional tensions escalated earlier in the year, moving from 2 EH/s to 3 EH/s.
Across North America, the United States remains the dominant jurisdiction with a 35.6 percent global share, but it recorded its third consecutive quarterly decline, falling to roughly 335 EH/s, down 14 percent year-over-year from its peak of 400 EH/s in Q1 2026. Canada continued its slide to 22 EH/s, representing a 27 percent annual drop—the sharpest decline among developed economies.
In Europe and Central Asia, Russia emerged as the quarter’s largest absolute gainer, adding 8 EH/s to reach 170 EH/s and an 18.1 percent global share. Kazakhstan stabilized at 15 EH/s, Norway held at 16 EH/s, and Georgia maintained 11 EH/s.
In the Asia-Pacific region, China’s hashrate eased further to 110 EH/s, continuing a steady multi-quarter bleed that marks a 24 percent annual decline. Indonesia and Malaysia continued to absorb regional capital, while Laos expanded to 9 EH/s.
Within the Middle East, Oman added 2 EH/s to reach 28 EH/s, successfully overtaking the UAE, which fell to 26 EH/s amid a 21 percent annual decline as local energy infrastructure pivoted toward high-performance computing.
Latin America saw Paraguay maintain its leadership position at 45 EH/s, while Venezuela’s climb to 10 EH/s provided the region’s main headline. Bolivia rose to 4 EH/s, while Argentina continued a steady descent to 3 EH/s driven by ongoing macroeconomic instability.
Finally, Africa’s flagship mining market in Ethiopia suffered a 35 percent reduction, pulling continental figures down as no other regional market possesses the scale to offset the deficit.
 Cryptocurrency Mining
 Cryptocurrency Mining
 Cryptocurrency Mining