In the world of algorithmic trading and quantitative analysis, few things capture the imagination quite like a pristine, upward-sloping equity curve. A strategy that seemingly prints money across historical market conditions is the ultimate aspiration for retail traders and institutional quants alike. However, veteran market participants often respond to flawless backtest results not with excitement, but with immediate skepticism. Behind many seemingly infallible trading systems lies a hidden statistical illusion, one frequently born from a subtle coding error or a deliberate misunderstanding of how historical data handles higher timeframes.
When a backtest looks remarkably pristine, the golden rule among experienced developers is to check how the algorithm reads higher timeframes before examining anything else. A recent analytical breakdown shared within the trading community highlights this exact vulnerability, using a Bitcoin chart on a one-hour timeframe to demonstrate how easily historical data can be inadvertently manipulated to look like an omniscient oracle.
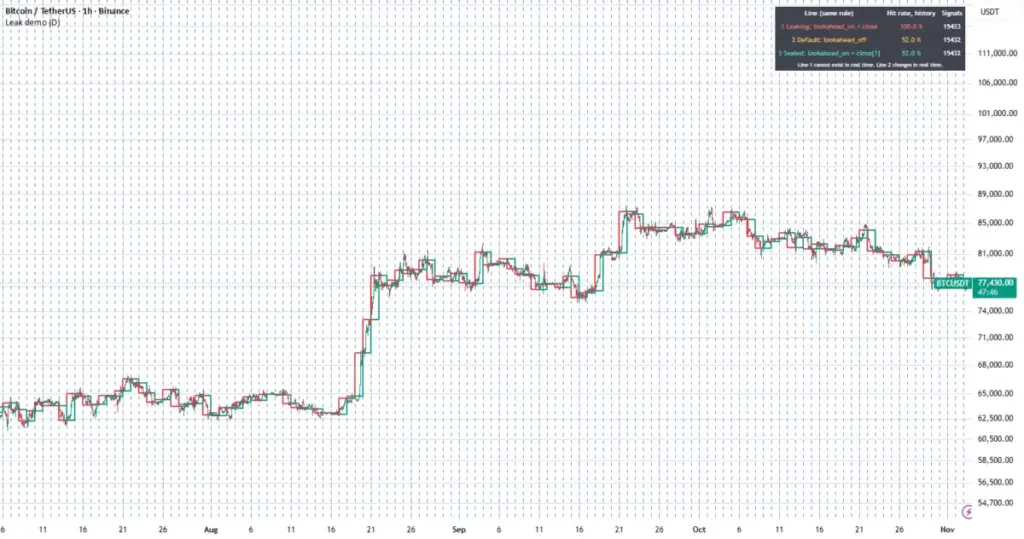
The demonstration utilized three distinct versions of the exact same daily market close mapped onto an hourly Bitcoin chart, exposing the profound differences between foresight, honesty, and real-time execution. The first version, highlighted in red, incorporated a specific function parameter known as request.security with lookahead_on combined with the standard close function. Within the boundaries of historical bars, this configuration allows the entire trading day to retroactively know how the day will ultimately conclude before the session has even unfolded.
The second version, rendered in orange, represented the default platform setting with the lookahead parameter turned off. On historical data, this setup appears honest because it waits for the daily session to close before recording the metric. However, when deployed in real time, it dynamically follows the forming daily bar and fluctuates continuously until the session officially concludes, creating a phenomenon known in the industry as repainting.
The third version, displayed in teal, combined lookahead_on with close[1]. This configuration evaluates the previous day’s close, yielding identical results whether viewed on historical charts or executed in live market conditions.
To test the practical implications of these variations, a deliberately naive trading rule was applied uniformly across all three configurations: if the plotted line sits above the current asset price, the day will finish higher than it is at that moment, and vice versa. When scored against the loaded historical dataset, the divergence in performance was staggering.
The red line version, empowered by lookahead bias, achieved an astonishing one hundred percent accuracy rate, correctly predicting price direction every single time. By contrast, both the orange and teal versions achieved a modest fifty-two percent accuracy rate.
The stark contrast driven by the exact same rule and the exact same underlying market data underscored a fundamental truth of quantitative finance. The flawless one hundred percent success rate was not a reflection of trading skill or market edge. Rather, it was a mathematical artifact of the answer being covertly copied directly into the question.
This distinction carries profound implications for real-world trading viability. A trading strategy built upon the foundation of the red line generates a mesmerizing, flawless equity curve inside a backtesting environment, yet it remains entirely untradable in live markets. In reality, a daily market close simply does not exist until the session clock runs out.
The orange version presents a subtler, more insidious trap for unwary traders. While its backtest appears honest on historical charts, alerts and trade executions can fire in real time based on intermediate values that subsequently shift and vanish as the candle continues to form. What looked like a winning signal during a simulation can evaporate mid-trade when the underlying bar closes differently than anticipated.
To protect against these invisible traps, experienced developers advocate for a rigorous verification checklist before placing any trust in a third-party or custom script. First, analysts must search the source code specifically for higher-timeframe calls using functions like request.security. Second, if the script utilizes the lookahead-on parameter, the data series must be properly offset by one period to prevent future data leakage. Third, if the script relies on default settings, the programmer must verify whether the trading signal patiently waits for the higher-timeframe bar to close or prematurely acts upon a bar that is still actively forming and susceptible to repainting.
The prevalence of this issue is surprisingly widespread, often hiding within popular indicators shared across online communities. A trader attempting to rebuild a widely distributed trend indicator that read twelve-hour and three-day bars through higher-timeframe security requests encountered this exact hurdle. Once the indicator was completely stripped of repainting mechanics and subjected to rigorous multi-market testing across thirty-one different cryptocurrencies and five distinct timeframes, not a single combination out of one hundred and fifty-five variants managed to pass the validation standard.
To help traders identify these flaws firsthand, the indicator utilized in the comparative chart demonstration has been made open source, allowing market participants to attach it to any asset symbol and inspect the data leakage for themselves. As quantitative developers frequently remind their peers, educational insights of this nature serve as a vital reminder that in the financial markets, if a backtest looks too good to be true, it almost certainly is.
 Crypto Investing & Trading
 Crypto Investing & Trading
 Crypto Investing & Trading