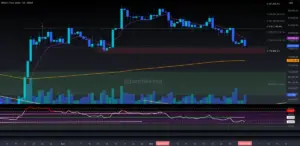
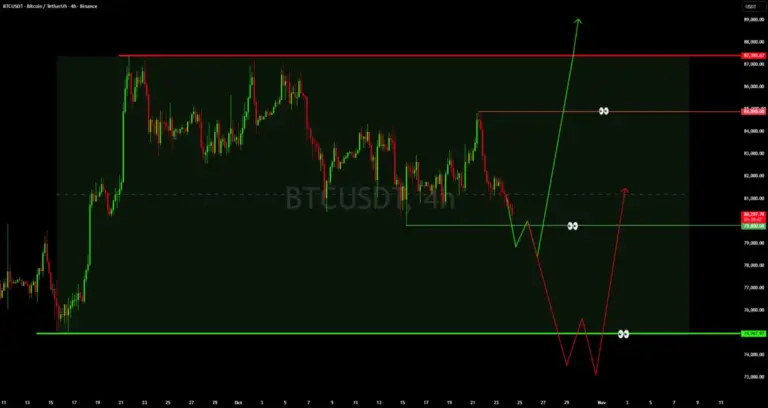
Cryptocurrency markets continue to experience heightened volatility, prompting seasoned analysts and traders to closely evaluate Bitcoin’s short-term trajectory. Market participant and analyst jonnieking has shared a fresh technical perspective on the leading digital asset, utilizing a metaphor of market movement—comparing the frequent trend shifts to an elevator going down, taking the stairs back up, and ultimately signaling another descent before a potential recovery—to describe the current price action unfolding on the charts.
At the center of this technical assessment is Bitcoin (BTC) trading below its 9-period Exponential Moving Average (9EMA). In technical analysis, the 9EMA is frequently monitored by short-term momentum traders to gauge immediate trend direction. When an asset trades persistently beneath this responsive moving average, it typically indicates that short-term selling pressure is outweighing buying momentum. According to the analysis, this positioning sets the stage for a retest of prior swing-high zones, specifically identifying the $75,000 to $76,200 range as a critical area of interest where market participants will be observing price behavior closely.
Beyond the immediate swing-high retest, the market outlook highlights a more substantial technical target further down the chart. The analysis points toward the 200-day Moving Average (200DMA), which currently sits around the $73,000 threshold. The 200DMA is widely regarded by both institutional and retail investors as one of the most significant macro trend indicators in technical analysis, often serving as a dividing line between broader bull and bear market regimes. A pullback toward this key moving average would represent a notable test of longer-term structural support for the cryptocurrency.

Supporting this bearish continuation thesis, the analysis draws attention to underlying momentum and market participation metrics, specifically noting a falling Relative Strength Index (RSI) alongside declining trading volume. The RSI is a momentum oscillator used to measure the speed and change of price movements, helping traders identify overbought or oversold conditions. A falling RSI during a period of price consolidation or downward movement suggests that buying enthusiasm is cooling off. Concurrently, declining volume indicates a lack of aggressive participation from buyers at current levels, further reinforcing the probability of a measured retracement toward deeper support levels before any renewed upward impulse can materialize.
This technical evaluation aligns with broader discussions surrounding Bitcoin’s cyclical behavior, fitting into ongoing analytical frameworks regarding the asset’s historical four-year halving cycles, moving average interactions, and Fibonacci retracement levels. Market analysts frequently rely on these overlapping technical confluences to anticipate market turns, particularly during periods when macroeconomic factors and midterm market cycles influence trader sentiment.
As Bitcoin navigates this phase of consolidation and potential correction, market participants across various platforms continue to monitor how price action reacts around these identified technical milestones. Whether the asset will find sufficient defensive buying at the projected support zones or experience extended downside volatility remains a primary focus for the trading community. As always, market observers are reminded that technical patterns provide probabilistic insights rather than absolute certainties, and broader market conditions can rapidly shift the prevailing trend.
 Crypto Investing & Trading
 Crypto Investing & Trading
 Crypto Investing & Trading