Sup Traders! In traditional economics, the concept of market equilibrium sounds reassuringly simple: supply and demand eventually match, and the price settles at a stable, rational level. However, in the fast-paced and highly volatile world of cryptocurrency, that delicate balance is a luxury that rarely lasts for long. Digital asset markets operate under a relentless current of shifting liquidity, sudden liquidations, and psychological extremes that make finding a permanent price floor or ceiling virtually impossible. Understanding how equilibrium forms, breaks, and resets is central to navigating the modern crypto landscape.
Market balance fundamentally means that buyers and sellers are roughly matched at a specific moment in time. When this parity occurs, trading activity stabilizes, and the asset appears to have found fair value. Yet, market dynamics in the crypto ecosystem shift at breathtaking speeds. Liquidity can vanish from an order book in a matter of seconds, leveraged positions can be aggressively flushed out by sudden price cascades, and the hard-won price equilibrium simply disappears. This transient nature is precisely why crypto market equilibrium should always be viewed as a moving target rather than a fixed destination.
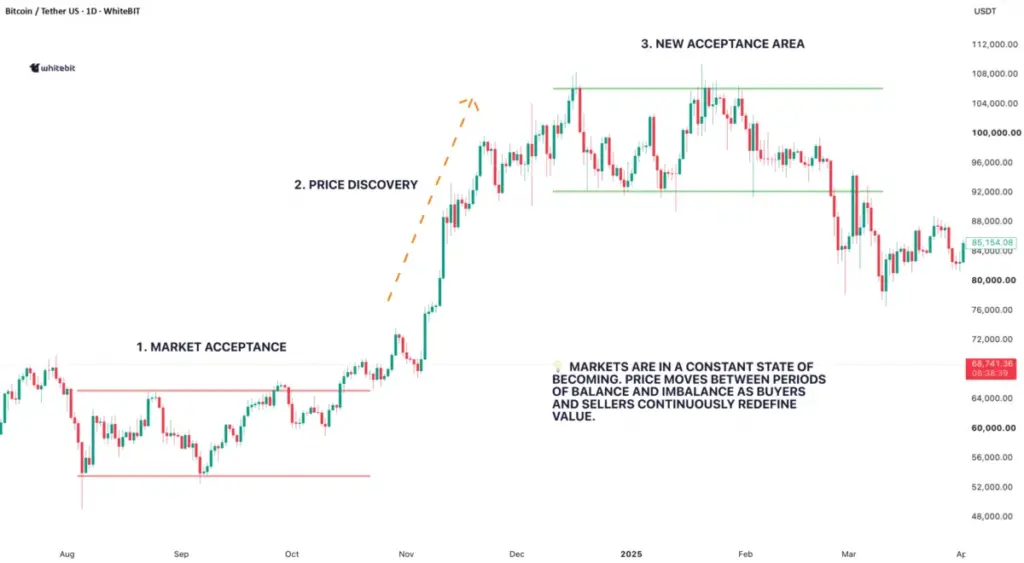
To comprehend how these shifts occur, one must first view cryptocurrency exchanges for what they truly are: continuous auction markets. In these digital auction houses, buyers submit bids, sellers offer their holdings, and the process of price discovery tirelessly works to find the specific levels where actual trading volume can take place. When heavy trading volume concentrates around a particular price, it signals a strong degree of market acceptance. Analysts often utilize a volume profile to highlight these heavily traded areas, identifying them as zones of interest where participants previously found agreement on value. Yet, in the crypto sphere, this collective acceptance can evaporate just as quickly as it materialized, leaving traders scrambling to reassess the landscape.
Price movement ultimately accelerates when a sudden imbalance occurs, happening when one side of the market overwhelmingly dominates the available liquidity. During these intense periods, aggressive buyers rapidly chew through resting sell offers, or determined sellers forcefully hammer the available bids. This systemic market imbalance acts as the primary catalyst pushing the price away from a stagnant range and toward another active zone of interest. In technical chart analysis, observing how market behavior unfolds around these zones reveals crucial clues about whether the incoming price action will stall out, decisively break through, or face a sharp rejection.
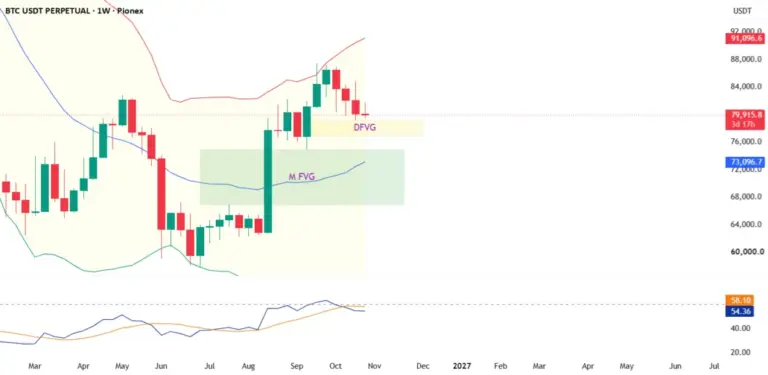
Nowhere is this cyclical behavior more visible than in the broader market structure of Bitcoin, the leading digital asset that routinely sets the tone for the entire sector. The Bitcoin market structure demonstrates this ongoing loop with remarkable clarity: BTC enters a consolidation range, liquidity steadily builds up beneath the surface, the delicate balance eventually breaks, and the price embarks on a journey to search for another area of recognized value. Historical market analysis consistently confirms the persistence of this exact repeating pattern, moving predictably through phases of balance, subsequent imbalance, aggressive discovery, and eventual acceptance.
Ultimately, balance never truly sticks in the digital asset economy. A potent cocktail of fluctuating liquidity, changing leverage ratios, pervasive fear, and the fear of missing out continuously reshapes the fundamental forces of supply and demand. Price manages to find a semblance of balance, trades comfortably within that confined range for a period of time, and then the overarching setup abruptly shifts. Rinse and repeat. As the digital asset markets continue to evolve, recognizing the temporary nature of equilibrium remains one of the most critical foundational concepts for anyone observing the daily ebb and flow of cryptocurrency trading.
This content is provided for informational and educational purposes only and does not constitute financial, investment, or trading advice.
The information and publications are not meant to be, and do not constitute, financial, investment, trading, or other types of advice or recommendations supplied or endorsed by TradingView.
 Crypto Investing & Trading
 Crypto Investing & Trading
 Crypto Investing & Trading