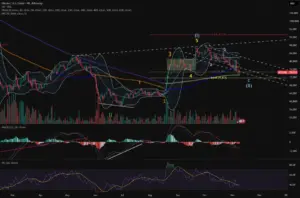
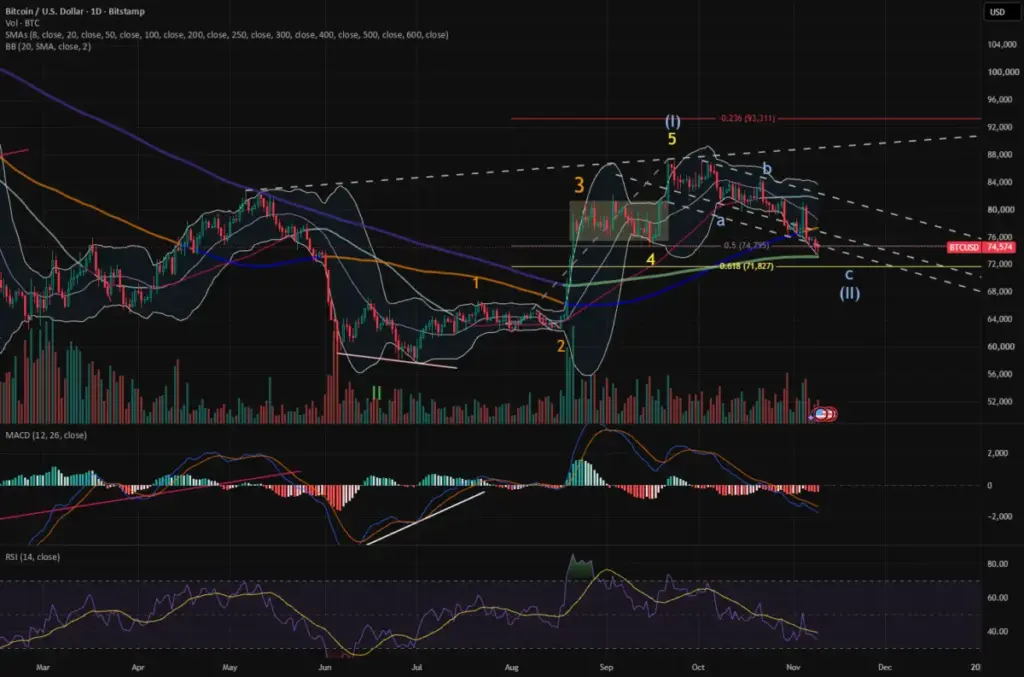
Market analysts monitoring technical structures are turning their attention to a familiar blueprint as recent price action mirrors historical setups from early 2023. According to updated wave structure assessments shared across financial charting platforms, the broader market has successfully completed a definitive five-wave sequence for Wave (I), paving the way for the development and impending conclusion of Wave (II).
The ongoing technical evaluation suggests that Wave (II) is currently navigating its final stage. Within classical Elliott Wave theory, corrective phases such as Wave (II) frequently retrace a significant portion of the preceding impulsive move. Technical indicators point toward a potential 61.8% retracement level as a key threshold for this corrective wave to find its footing. Adding to the technical confluence, the 200-day moving average (200-D MA) is positioned directly overhead, creating a dense cluster of potential resistance and support dynamics that market participants are closely watching.
This structural setup bears a striking resemblance to market behavior observed during the February and March 2023 trading period. During that timeframe, Wave (II) experienced a notable downward spike that breached the 200-day moving average before eventually reversing, though it ultimately fell short of reaching the deeper 61.8% retracement marker. The repetition of this architectural pattern has heightened interest among technical analysts who rely on historical price geometry to anticipate potential inflection points in broader market trends.

The methodology underpinning these observations, rooted in Elliott Wave analysis and wave theory, focuses on identifying repetitive fractal patterns that reflect investor psychology and market sentiment cycles. Impulsion phases, categorized by five-wave structures like Wave (I), demonstrate strong directional momentum, while corrective phases like Wave (II) represent counter-trend pullbacks that test the conviction of market participants before the primary trend resumes.
As the current corrective sequence approaches its anticipated conclusion near these key technical boundaries, market observers remain vigilant. Whether the current price action will strictly replicate the February-March 2023 trajectory by stopping short of the 61.8% retracement or push deeper into standard corrective territory remains a central question for technical strategists assessing the next major directional phase.
As is standard practice across financial analysis communities, market participants are reminded that technical evaluations and wave structure updates are intended for observational and analytical purposes. Financial platforms host a wide variety of analytical insights, yet these publications do not constitute formal financial, investment, trading, or other types of professional advice or recommendations. Those seeking to make financial decisions are encouraged to review the comprehensive terms of use and disclaimers provided by respective platforms regarding investment decisions and market participation.
 Crypto Investing & Trading
 Crypto Investing & Trading
 Crypto Investing & Trading