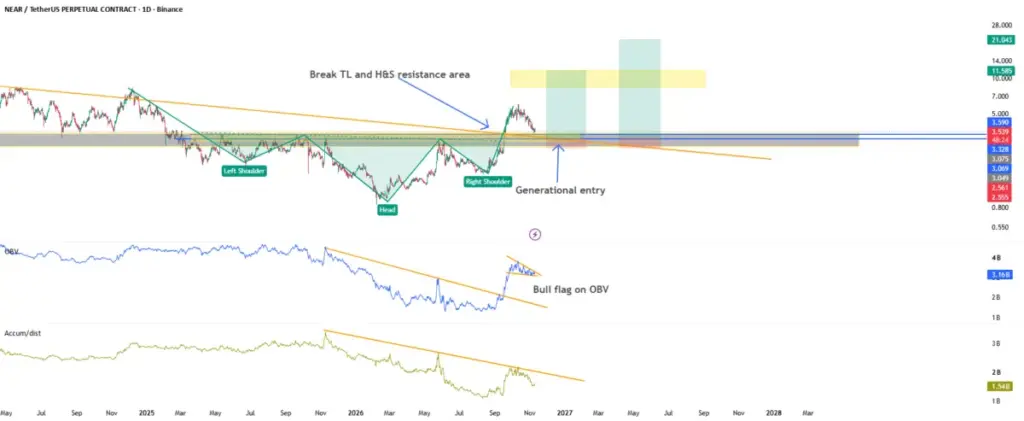
A closely watched digital asset market setup is currently generating significant discussion among technical analysts following a decisive breakout above major overhead barriers. According to recent market observations, the asset’s price action has successfully pierced both the neckline of an inverse Head and Shoulders formation and a long-standing descending resistance trendline. This technical development is being interpreted by market participants as a potential structural shift, transitioning the broader market narrative from a sustained bearish phase into an emerging bullish outlook.
In classical technical analysis, the inverse Head and Shoulders pattern is one of the most reliable reversal formations. It typically materializes at the conclusion of a prolonged downtrend, signaling exhaustion among sellers and a gradual accumulation phase by buyers. The recent breach of the pattern’s neckline, reinforced by the simultaneous violation of a persistent descending resistance trendline, suggests that upside momentum is building. Analysts tracking the move note that the market is currently undergoing a crucial phase of validation through a secondary price reaction.
At present, the market is witnessing a textbook retest of the former resistance zone. In healthy market mechanics, broken resistance levels frequently flip polarity to act as localized support. Observers are monitoring this pullback closely, as it could establish a solid foundation for buyers and present an attractive accumulation window for participants looking to position themselves ahead of a potential trend continuation.
Supporting the price action is a concurrent development in volume-based indicators, specifically the On-Balance Volume (OBV). The OBV metric, which utilizes volume flow to predict changes in stock or asset price, has successfully broken its own major descending trendline. Furthermore, the indicator is currently carving out a bullish flag formation. Market technicians emphasize that a confirmed breakout from this current consolidation phase within the OBV would significantly strengthen the broader bullish continuation scenario, adding institutional and volume-backed validation to the ongoing price recovery.
Within the framework of this technical setup, market participants are outlining specific strategic parameters to manage potential risk and reward trajectories. The proposed accumulation zone, or dollar-cost averaging (DCA) range, is currently identified between 3.00 and 3.50. To protect capital against a false breakout or a sudden resumption of the prevailing downtrend, a strict stop-loss level has been established at 2.50. Should the bullish thesis unfold as anticipated, initial targets for upward price expansion are pegged between 8.30 and 11.50 for the first primary objective, with a secondary target zone extending from 18.00 to 20.50.
Monitoring these levels requires a disciplined approach, with traders keeping a close eye on several key confirmation signals. A successful defense of the former resistance-turned-support zone, accompanied by visible bullish price rejection wicks and the aforementioned breakout of the OBV flag, would provide the necessary confluence to validate the setup further. The foundational thesis underlying this market outlook remains straightforward: former resistance transforms into support, market buyers step in to defend the breakout boundary, and price action initiates its next measured bullish expansion phase.
However, market dynamics dictate strict adherence to risk parameters, and any definitive move downward to the 2.50 threshold would invalidate the current trade setup, signaling that the bearish structure remains intact. As with all analytical insights shared within the technical trading community, these observations represent a specific methodology for interpreting market charts and do not constitute formal financial, investment, or trading advice. Market participants are consistently urged to exercise caution and maintain rigorous risk management strategies when navigating volatile asset classes.
In accordance with standard industry disclosures, the information and publications provided in market updates are not meant to be, and do not constitute, financial, investment, trading, or other types of advice or recommendations supplied or endorsed by TradingView.
 Crypto Investing & Trading
 Crypto Investing & Trading
 Crypto Investing & Trading