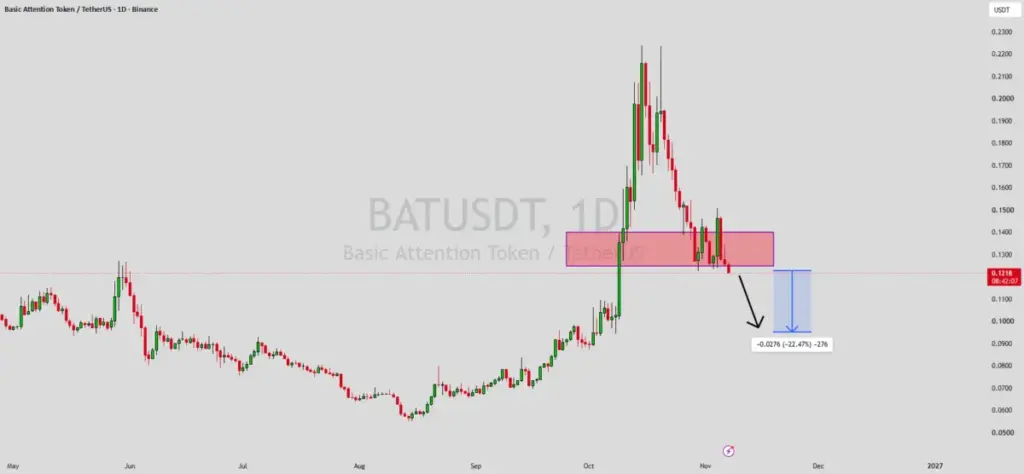
The market for Basic Attention Token against Tether (BATUSDT) is facing severe downward pressure on the daily timeframe, following a failed attempt by market participants to maintain positions within a pivotal historical support zone. The digital asset has struggled to preserve its valuation after slipping below the crucial demand band ranging from $0.125 to $0.140, a structural threshold that previously acted as a springboard for buying interest. Following an aggressive rejection from its October peak, the persistent imbalance between supply and demand has become increasingly apparent, as buyers failed to absorb the heavy selling volume that materialized across the broader session. This inability to defend critical price levels ultimately caused the asset to breach the lower boundary of the demand range, accelerating its descent toward the $0.122 region.
The breakdown carries significant technical implications for market participants monitoring the daily charts, as it signals that sellers have firmly seized control of short-term market dynamics. The zone that once served as a robust support band has now flipped into an immediate resistance hurdle, complicating any potential recovery efforts by the remaining bullish factions. A series of sustained red daily candles moving consistently below this historical zone reflects persistent distribution across the order books. Furthermore, the notable absence of any visible absorption or aggressive bullish reactions to defend current pricing levels highlights a broader lack of buying conviction at this stage of the market cycle.
Looking ahead at the evolving market structure, the path of least resistance for BATUSDT currently points toward further downside exploration as the broader bearish continuation unfolds across the daily timeframe. Technical projections derived from the current price action and historical volatility patterns outline a potential drop of approximately 22.47% from the breakdown point. This downward trajectory establishes an initial downside target near the $0.095 mark, an area where the trading pair could potentially seek a structural base to stabilize its losses and establish a foundation for future market phases. As market conditions continue to develop, participants remain focused on how price action responds as it approaches these lower historical liquidity zones.
Disclaimer
The information and publications are not meant to be, and do not constitute, financial, investment, trading, or other types of advice or recommendations supplied or endorsed by TradingView.
 Crypto Investing & Trading
 Crypto Investing & Trading
 Crypto Investing & Trading