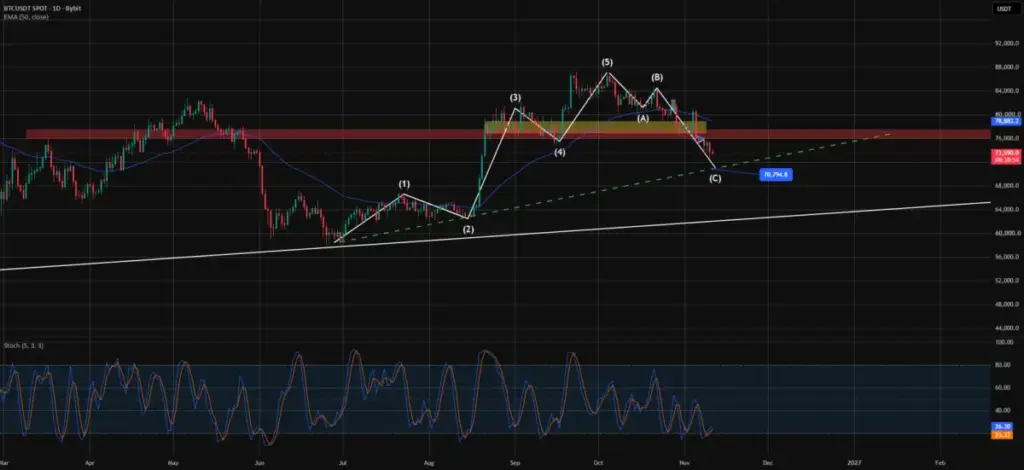
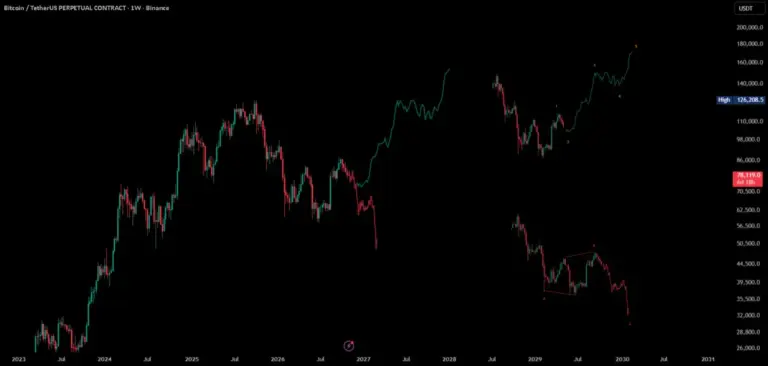
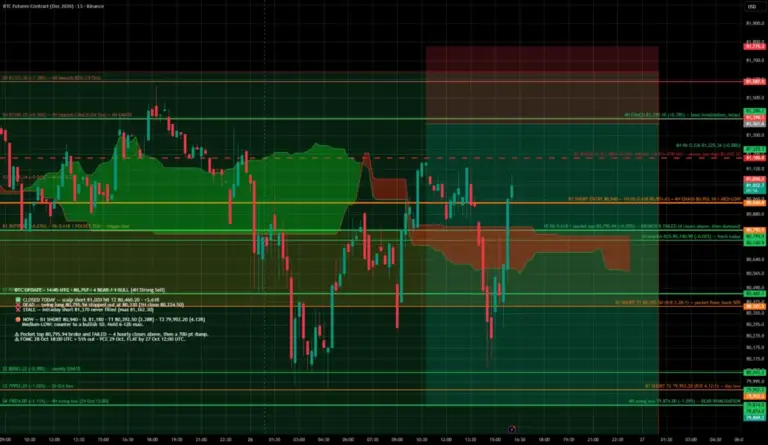
Cryptocurrency markets continue to experience intense scrutiny from technical analysts and traders alike, with Bitcoin remaining the central focus of global price action. In a recent market update published on TradingView, cryptocurrency analyst xplorecoding21 shared a bearish short-term outlook for Bitcoin (BTCUSDT), utilizing Elliott Wave principles to forecast a potential correction that could drag prices down toward the $69,000 to $79,000 range. The analysis highlights growing caution among market participants as Bitcoin navigates complex macro and micro technical formations on spot exchanges such as Bybit.
The observation, shared on Wednesday, November 11, 2026, centers on wave analysis and trend identification, two cornerstone methodologies used by technical traders to anticipate future market directions based on historical price movements and psychological cycles. According to the breakdown provided by the analyst, the current market structure suggests that Bitcoin may have completed or is in the process of completing a larger impulsive cycle, paving the way for a corrective wave. In the context of Elliott Wave Theory, corrective phases typically retrace a significant portion of prior gains, offering a theoretical framework for projecting lower support levels during a bearish retracement.
The specific target zone identified in the analysis—ranging between $69,000 and $79,000—represents a substantial pullback from higher valuation levels, a movement that would likely trigger widespread discussion across the digital asset ecosystem. Elliott Wave analysis is rooted in the idea that market prices move in repetitive wave patterns driven by collective investor psychology, alternating between impulsive trends and corrective counter-trends. When applied to high-volatility assets like Bitcoin, these models are
closely watched by short-term traders looking for tactical entry and exit points, as well as long-term investors assessing risk management strategies.

The market update specifically targets the BTCUSDT trading pair on Bybit, reflecting real-time spot market dynamics where liquidity and order book depth often dictate immediate price reactions. Short positions, such as the one referenced in the analyst’s configuration, are typically deployed by traders anticipating a decline in asset value, allowing them to profit from downward momentum or hedge existing long portfolios against potential market downturns. As cryptocurrency markets remain open around the clock, technical predictions of this nature are frequently evaluated and debated within trading communities, influencing sentiment across various social and analytical platforms.
Technical analysis, while widely utilized, operates as a probabilistic tool rather than a definitive roadmap for future market behavior. Analysts frequently emphasize that market conditions can shift rapidly due to unexpected macroeconomic data, regulatory announcements, or sudden shifts in liquidity. Consequently, projections based on trend analysis and wave structures are subject to invalidation if price action breaks key resistance or support thresholds. The commentary provided by xplorecoding21 serves as a snapshot of prevailing technical sentiment on the platform, contributing to the broader discourse surrounding Bitcoin’s ongoing price discovery phase.
As is standard practice across major financial and cryptographic publishing platforms, the publication of such market insights is accompanied by clear regulatory disclaimers. Information and publications shared on platforms like TradingView are designed for informational and analytical purposes and do not constitute formal financial, investment, or trading advice. Readers and market participants are generally encouraged to conduct their own independent research and risk assessments before engaging in trading activities or altering their investment portfolios, keeping in mind the inherent volatility and risk associated with digital asset markets.
The ongoing focus on Bitcoin’s technical posture underscores the sensitivity of the broader cryptocurrency market to wave counts, trend lines, and historical support zones. Whether Bitcoin ultimately tests the projected $69,000 to $79,000 range or finds sufficient buying pressure to invalidate the bearish wave count will depend heavily on subsequent volume dynamics and broader market participation in the days and weeks ahead.
 Crypto Investing & Trading
 Crypto Investing & Trading
 Crypto Investing & Trading