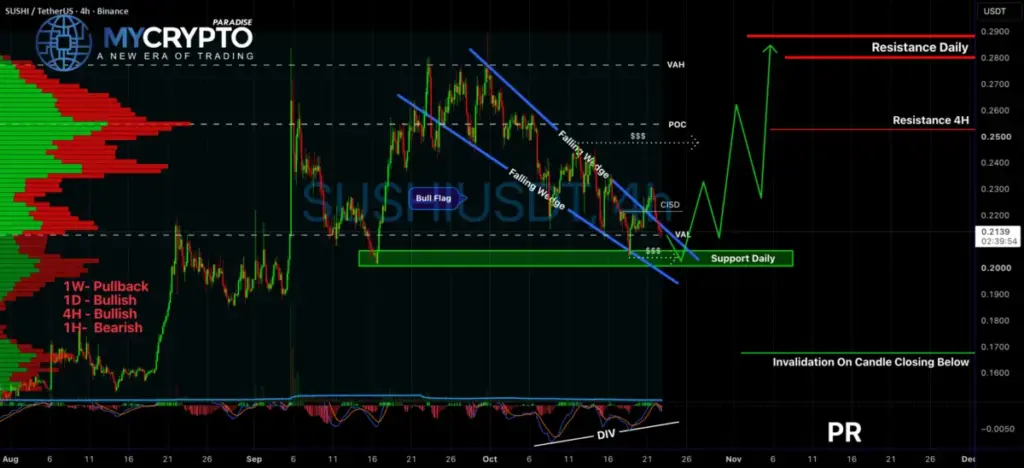
As digital asset markets continue to navigate periods of high volatility, traders are closely monitoring the price action of SUSHI/USDT. Currently hovering around the $0.2132 mark, the token is presenting a complex multi-timeframe technical setup. While short-term indicators suggest caution may still be warranted due to lingering downside pressure, a convergence of bullish chart patterns and key structural supports points toward a potential significant upside opportunity for market participants willing to exercise patience and disciplined risk management.
Market analysts reviewing the four-hour chart point to a developing setup that could precede a major trend shift. However, navigating this environment requires a nuanced understanding of how different timeframes are currently interacting. At present, the weekly timeframe remains entrenched in a broader pullback phase, reflecting the prolonged consolidation periods experienced across significant segments of the altcoin market. Conversely, the daily and four-hour timeframes exhibit growing bullish potential, hinting that underlying momentum may be shifting in favor of the buyers over a medium-term horizon.
The immediate intraday picture tells a slightly more cautious story. The one-hour timeframe remains bearish, indicating that the market may experience another short-term correction or downward push before buyers can decisively regain control of the price action. This conflicting short-term momentum has led market observers to emphasize the importance of key technical zones rather than rushing into premature positions.
Key Support Zones and the Threat of a Final Liquidity Sweep
Attention is currently centered on the daily support zone, which spans approximately from $0.201 to $0.207. This critical price band aligns closely with the lower boundary of an ongoing descending structure. Market participants are watching this area closely, as it represents the most logical region where SUSHI could attract renewed buying pressure and form a definitive local bottom.
However, experienced market participants understand that price rarely moves in a straight line, especially when lower timeframes display bearish momentum. A prevailing theory among technical analysts monitoring the pair is the possibility of a final liquidity sweep. Such a move would see the price dip temporarily toward or even slightly below the daily support zone, effectively shaking out impatient or premature long positions before any sustainable recovery can take root. This type of price action is frequently observed in crypto markets, where market makers often target leveraged long positions clustered near obvious support levels before initiating a genuine reversal.
If buyers step in to successfully defend this support zone and invalidate the short-term bearish pressure, the stage could be set for a more aggressive upward continuation. The formation of these structural dynamics often precedes sharp reversals, catching market participants off guard who positioned themselves too early or panicked during the final sweep.
Bullish Technical Structures and Momentum Indicators
Supporting the potential for a bullish reversal are several prominent technical formations visible on the charts. Most notably, the price action has been carving out a falling wedge structure. In technical analysis, a falling wedge is traditionally interpreted as a bullish reversal pattern, provided it is ultimately confirmed by a decisive breakout above its upper resistance trendline.
Furthermore, this falling wedge appears to be nested within a broader bullish flag formation. The presence of a larger continuation pattern suggests that the recent downward correction may simply be a temporary retracement within a larger macro structure rather than the onset of a prolonged, structural downtrend. This harmonization across different degrees of trend patterns gives weight to the idea that current price levels might represent an accumulation phase for patient market participants.
Momentum indicators are also beginning to reflect underlying shifts in market psychology. The Moving Average Convergence Divergence (MACD) indicator is currently displaying a bullish divergence. While the price structure itself has remained under downward pressure, creating lower or sideways movement, the momentum indicators are forming higher lows. This technical divergence frequently signals that selling pressure is beginning to exhaust itself, even if the price has yet to reflect that change overtly. Nonetheless, analysts caution that waiting for formal confirmation from these indicators is essential before acting on potential signals.
Upside Targets and Critical Invalidation Levels
Should the anticipated scenario play out—featuring a successful defense of the daily support zone followed by a confirmed bullish breakout from the falling wedge structure—market analysts have mapped out several logical upside targets. The initial resistance level that buyers would need to challenge lies around the $0.252 mark on the four-hour chart. Overcoming this hurdle would provide early confirmation of strength and pave the way for a more substantial recovery.
A sustained breakout above the $0.252 resistance would open the door toward a more significant daily resistance zone situated between $0.280 and $0.290. Achieving this target range from current trading levels around $0.2132 would represent a substantial upward movement, translating to approximately 31% to 36% in potential gains.
At the same time, risk management protocols dictate strict adherence to invalidation levels to protect capital against unexpected macroeconomic shifts or sudden changes in market sentiment. Analysts note that a decisive candle close below approximately $0.168 would invalidate the broader bullish scenario currently outlined on the charts. While losing the immediate daily support zone earlier in the sequence would already significantly weaken the bullish setup, a breach of the $0.268 threshold would signal a complete breakdown of the current technical thesis, forcing traders to reassess the macro health of the asset.
As the market approaches these critical junctures, the overarching consensus among seasoned market observers emphasizes that identifying a promising technical setup is only part of the equation. In high-volatility environments like cryptocurrency trading, waiting for proper confirmation, enforcing strict risk management frameworks, and avoiding emotional decision-making remain the primary traits that differentiate disciplined market participants from reactive speculators. Navigating the evolving SUSHI/USDT landscape will require patience, vigilance, and strict adherence to predetermined trading strategies as the market decides whether to complete a final liquidity sweep or immediately begin its next bullish phase.
 Crypto Investing & Trading
 Crypto Investing & Trading
 Crypto Investing & Trading