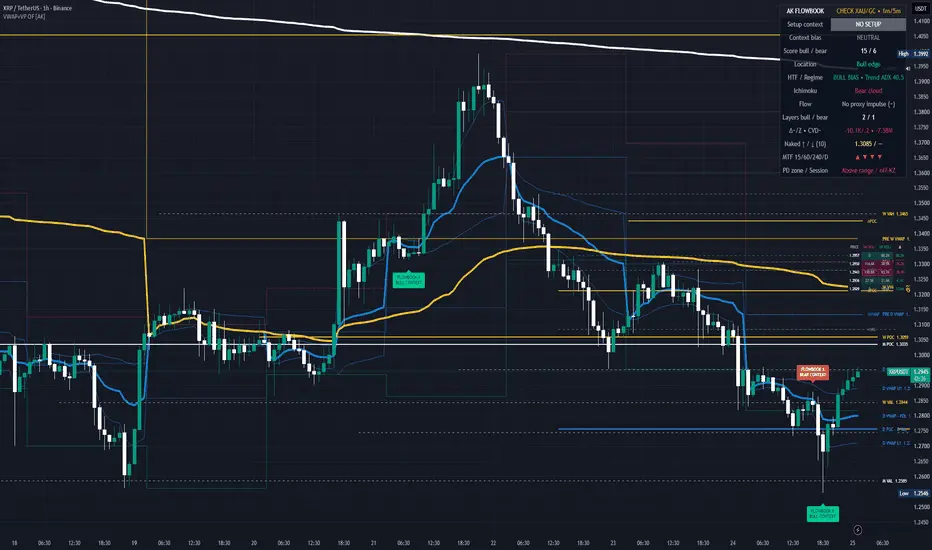
Cryptocurrency markets are constantly testing the resilience of traders and automated algorithms alike, offering glimpses into underlying market mechanics through granular order flow analysis. Recent market activity surrounding XRP on the Binance exchange has provided a textbook demonstration of this dynamic. Market participants monitoring the XRPUSDT spot pair on 1-minute candle formations, utilizing a 0.002 price row configuration alongside real taker delta metrics—calculated as buy volume minus sell volume—have identified a compelling bullish setup. Supported by a 3-month volume profile drawn from 1-hour candles and visualized via the Volume Profile Order Flow Map developed by AK FlowBook, analysts are leaning toward a long bias above the 1.284 price threshold, targeting an immediate ascent toward this week’s Point of Control at 1.304, followed by the Volume Weighted Average Price sitting at 1.322.
The foundational thesis for this bullish bias rests on a sequence of events that began with a classic liquidity sweep of the previous week’s low. During the trading week spanning from October 12 through October 18, XRP established a local bottom at the 1.2562 mark. However, weekend market conditions often introduce heightened volatility due to thinner liquidity, and Saturday’s session brought a sharp downward flush that momentarily pierced this structural floor. At approximately 15:30 UTC, prices dipped to a low of 1.2546, coinciding with the day’s heaviest selling pressure.
Order flow data from that crucial hour reveals the extent of the selling intensity. The 13:00 UTC hour recorded a taker delta of approximately negative 833,000 XRP. This downward pressure escalated during the subsequent hours, with the 14:00 UTC hour logging negative 730,000 XRP, culminating in a heavy sell imbalance of negative 1.33 million XRP during the 15:00 UTC hour. Despite this aggressive wave of selling and the breach of the previous week’s low, a deeper examination of the micro-timeframe candles reveals a telling detail: not a single 1-minute candle managed to close below the critical 1.2562 level. This price action strongly indicates that the downward move served primarily to hunt and trigger resting stop-loss orders positioned beneath the swing low. Once those liquidity pools were thoroughly cleared, buyers stepped in aggressively, causing the price to reverse course and surge straight back upward.
Following this liquidity sweep, XRP successfully reclaimed ground within the current week’s established value area, which spans from 1.284 to 1.344. Within this broader value bracket, the Point of Control, representing the price level with the highest traded volume for the period, sits at 1.304, while the benchmark VWAP rests at 1.322. The recovery back into this value zone was swift and decisive. The very first 1-minute candle to register a close back above the 1.284 threshold occurred at 18:29 UTC. Since that moment, market activity has shown remarkable strength, with out of 226 subsequent 1-minute closes, only two dipped momentarily below the 1.284 line.
A closer look at the hourly candle closes starting from 18:00 UTC underscores this persistent upward momentum. The sequence of hourly closes progressed systematically from 1.2869 to 1.2887, then to 1.2916, followed by 1.2927, and reaching 1.2951. This consistent progression demonstrates that every single hour closed higher than the previous one, signaling a steady and methodical reclamation of market territory by the buying side.

Compounding this structural recovery is a phenomenon known to order flow traders as supply absorption. Since 16:00 UTC, the cumulative taker delta has remained in negative territory at approximately negative 515,000 XRP. Ordinarily, sustained selling pressure reflected by a negative delta would drive prices lower. However, during this exact timeframe, the price of XRP actually climbed from 1.268 to 1.295. This divergence between delta and price movement reveals that sellers are continuously hitting the bid, yet passive buyers are stepping in to absorb all the incoming supply without allowing the market to drop. This absorption suggests that large-scale participants are accumulating positions, absorbing the remaining selling pressure before a potential larger push upward.
Furthermore, an analysis of the volume map reveals a favorable structural landscape for the asset’s upward trajectory. On the broader 3-month volume profile, the price rows between 1.29 and 1.30 exhibit heavy volume concentration. Moving slightly higher, the 1.31 to 1.32 rows hold roughly half that volume, while the next major heavy volume shelf does not appear until the 1.33 to 1.34 range. This topographical layout means that once the price successfully establishes acceptance at the 1.304 Point of Control, there is a relatively thin volume pocket overhead. In order flow theory, prices tend to travel rapidly through low-volume nodes because there is minimal structural resistance or resting liquidity to halt the movement, allowing XRP to potentially advance toward the 1.322 VWAP target with relative ease.
Despite these supportive technical indicators, a prudent evaluation of the market requires acknowledging the counterarguments and prevailing headwinds. Skeptics note that Saturday’s cumulative full-day delta remains heavily skewed to the downside at approximately negative 3.7 million XRP, while the weekly aggregate delta sits at roughly negative 15.6 million XRP. Additionally, overall weekend liquidity remains characteristically thin, which can occasionally lead to exaggerated price movements or false breakouts that lack institutional follow-through.
Furthermore, the immediate price action faces an important technical test right at the current levels. The market must contend with Saturday’s daily high of 1.2961 and Saturday’s value high of 1.294. If the price stalls at these immediate hurdles and subsequently experiences a reversal that closes back underneath the 1.284 support level, it would signal that the bullish buyers have failed to maintain control, throwing the recent recovery into question.
Ultimately, the entire bullish thesis is bound by a strict risk management parameter. The setup faces complete invalidation if the market prints a 1-hour candle close below 1.274, which marks Saturday’s value low. Should that invalidation level be breached, it would indicate that the initial liquidity sweep ultimately failed, opening the door for a retest of the 1.2546 low established during the weekend flush. As always, rigorous market analysis and technical forecasting require strict adherence to predefined risk parameters, and market participants are advised to manage their own risk accordingly in accordance with professional trading standards.
 Crypto Investing & Trading
 Crypto Investing & Trading
 Crypto Investing & Trading